- Submissions

Full Text
Archaeology & Anthropology:Open Access
Investigation of the Degradation Stages of Archaeological and Historical Silk Textiles: An ATR-FTIR Spectroscopic Study
Sevim A*
Department of Physics, Turkey
*Corresponding author: Sevim A, Department of Physics, Turkey
Submission: February 20, 2019;Published: February 25, 2019

ISSN: 2577-1949 Volume3 Issue1
Abstract
Silk fibers are found in many important historic textiles and artefacts. Raw silk is a proteinaceous fiber consists of two major proteins: The main fibrous component fibroin, and amorphous protein sericin. In commercial use, sericin is normally removed by degumming. Fourier transform infrared (FTIR) spectroscopy is a powerful tool for fiber identification and can provide both qualitative and quantitative information about protein conformations. The amino acid composition of fibroin and sericin significantly differs from each other, thus they can be easily differentiated by IR spectroscopy. In this study some archaeological silk textile specimens, obtained during the excavations in Ancien Ainos (Enez), one of the most important archaeological sites in Turkey together with 150 years old and new Bombyx mori silk textiles were investigated using Attenuated Total Reflectance-Fourier transform infrared (FTIR) spectroscopy. The main aim of our research was to investigate conformational changes of silk protein, caused by ageing depending on the environmental conditions. It was found that structural transformations from β-sheet domain to β-turn and disordered conformations occur due to degradation. By aging, the changes in molecular structure and the formation of oxidative moieties were investigated. The crystallinity and oxidation degrees of the silk fibroin were defined by the investigations of the ratios of integrated intensities of β-Sheet to disordered structure and the integrated intensity ratios of Amide I/amide II, respectively.
Keywords: Amide bands; Bombyx mori silk; Degradation; IR spectroscopy; Protein secondary structure
Introduction
Historical textiles reflect the people’s culture, the materials available for civilization, as well as the technologies of the period, and are therefore an important reference source for cultural research. Silk fibers are found in many important historic textiles and artefacts [1-3]. By means of infrared (IR) spectroscopy the vibrational frequencies of the molecules are examined. Since these vibrational frequencies vary depending on the molecular structure, and molecular interactions, information about the molecular structure, molecular bonds and molecular interactions can be obtained by examining the intensity, band half-width and the frequency changes of the IR spectral bands [4]. Fourier transform infrared (FTIR) spectroscopy has emerged as a versatile and important analytical technique to identify of unknown compounds, or to determine the chemical structure of the components. In fact, the use of the attenuated total reflection (ATR) attachment greatly facilitated the use of this technique and allowed direct measurements from solid samples such as fabrics.
Raw silk is a proteinaceous fiber consists of fibrous protein component fibroin, and amorphous protein component sericin. In commercial use, sericin is normally removed by degumming. The amino acid compositions of these protein components of silk significantly differ from each other [1,3], thus they can be easily differentiated by IR spectroscopy. Ancient Ainos (nowadays called Enez) is one of the most important archaeological sites in Turkey [5]. During the excavations in 2005-2006 years, some textile specimens have been found and identified as raw silk [1]. In this study, the ATRFTIR spectroscopy was used to investigate some archaeological silk textile specimens obtained during the excavations in Enez together with an old and a new Bombyx mori silk textiles. The main aims of our research were to investigate the secondary structure changes of silk protein, caused by ageing depending on environmental conditions and to examine their degradation stages of textiles.
Methodology
The FTIR spectra of silk fiber samples were recorded using a Bruker Tensor FTIR spectrometer equipped with a diamond ATR unit. The data were collected over a spectral range of 4000-400cm-1 and 200 scans were collected with a resolution of 1cm-1. Standard correction for ATR spectrum was applied. Spectral manipulations such as baseline adjustment, smoothing, obtaining the second derivative and curve fitting procedures, were performed using GRAMS/AI 7.02(Thermo Electron Corporation) software package. Curve fitting was done using Voigt function (the convolution of a Gaussian and Lorentzian distributions) and fitting was undertaken until reproducible and converged results were obtained with squared correlations better than r2~0.9999./
The second derivative profile gives valuable information about the position of the bands and bandwidths. Thus, for the curve fitting procedure (to locate the position of the peaks), the second derivative of the absorption spectrum was used as a guide. The second derivatives of the spectra were obtained by using Savitzky– Golay function (two polynomial degrees, 17 points). For SEM and EDS measurements, Scanning Electron/Focused Ion Beam Microscopy FEI Versa 3D Dual Beam system with Ga+ ion source was used. Samples were not coated with a metal. The method applied is non-destructive, enabling the re-testing of the same sample with another method. Acceleration voltage was 2.00kV.
Results and Discussion
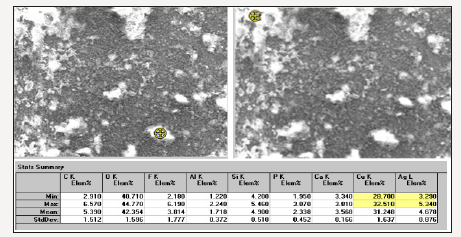
The ATR-FTIR spectra of the investigated six silk textiles are shown in (Figure 1). The excavated textiles (Figure 1 sample No 1-4) were metal ornamented textile pieces, and EDS analysis indicated that they were made of silver-plated copper wrapped silk threads. Metal threads were used commonly in ecclesiastical textiles of the Greek cultural heritage [6]. These textiles (sample 1-4) were unearthed near Chapel Hagios Gregorios Neokaiserias, in the middle of the Ainos Fortress [1]. The average result of the EDS analysis of the several points of the metal part of sample No 1 is shown in Figure 2. The Cu content is found to be 28.7-32.5 % and Ag is 3.29-5.34 % (Figure 2).
Figure 1:The ATR-FTIR spectra of the investigated silk textiles; No 1-4 are archaeological textiles, excavated in Enez, no 5 is a 150 years old textile and No 6 is a new one.
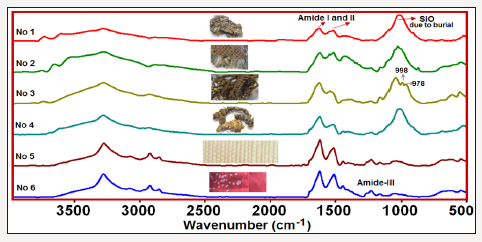
Figure 2:The EDS analysis of the metal ornamental part of the archaeological textile No 1.
The SEM/FIB images of the 150 years old silk textile are shown in Figure 3. It could be seen that silk fibers had diameter of about 9.0-16.4μm Figure 2. The surface was smooth and clean and had no roughness (Figure 3).
In the IR spectra of the all investigated samples, amide I and amide II bands, which are characteristics of the protein structure, are observed. Moreover, in some samples the 998cm-1 and 975cm-1 bands, which are typical of Gly-Ala sequences in silk fibroin [7-9], are clearly seen, and in the others, these bands are predicted from the second derivative profiles and band fitting procedures. The main difference of the archaeological (samples 1-4) from the other silk textiles, is the observation of the strong Si-O stretching band of soil around 1000cm-1 due to burial. The comparison of the 1900- 400cm-1 region of the sample 3 (excavated raw silk) and sample 5 (150 years old B. mori silk) are shown in Figure 4. The signature bands of silk fibroin at 998 and 975cm-1 are clearly shown.
Moreover, the sericin band at 1112cm-1 [1] was observed only in the IR spectra of the excavated textiles, indicating that they were raw silk. The presence of intensity and frequency alterations of the amide-I and II bands depending on the degradation of silk are also seen in the Figure 4. It must be noted that the sample 5 was 150 years old B. mori silk, whereas, sample 1 was the archaeological raw silk, probably belong to Roman period [1]; (Figure 4).
Figure 3:The SEM (a) and FIB (b-c) images of sample 5. The scale bars were (a) 500m (b) 200m (c) 50m
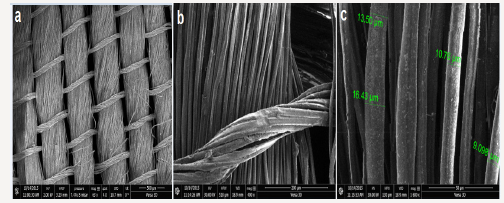
Figure 4:Comparison of the ATR-FTIR spectra (a) sample 3 (excavated silk textile) (b) sample 5 (150 years old B. mori silk textile).

Conformational varieties of the proteins can be probed through amide bands; particularly amide I band is the most sensitive to the secondary structure of protein. Amide I mode is primary a C=O stretching motion. It may have some contributions from CN stretching and CCN deformation [4,10]. An amide I band around 1620-1641cm-1 together with weaker contributions around 1674- 1697 are generally attributed to β-sheet structures [4]. The IR band components in the 1662-1686cm-1 region reflect the contribution of β-turn. Silk protein fibroin has a high degree of crystallinity with β-sheet crystallites aligned along the fiber axis. Thus, the degree of the crystallinity of the silk fibroin can be estimated through detailed investigation of amide bands, since the wavenumbers of amide bands of β-sheet, β-turn and disordered conformations are different [4,10]. Recently Koperska et al. [11] examined the degradation of the silk’s fibroin and found that the relative intensity of the amide II band in comparison to the Amide I band decreased due to the degradation. They proposed that degradation stages of the silk fibroin could be predicted by examining of the intensity radio of Iamide-I/ Iamide II.
Figure 5:Amide- I and –II bands of the investigated samples 2, 3, 5 and 6.
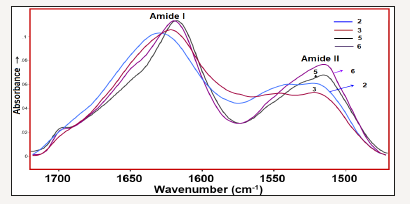
The comparison of the amide I and II bands of the selected silk textiles are shown in Figure 5. As seen in Figure 5, the intensity radio of Iamide-I/Iamide II (where Ix is the height of band x) is altered depending on the aging of silk fibroin. Namely, the Iamide-I/Iamide II ratio increases as the degradation stage of the silk fibroin increase (Figure 5). The curve fitted amide I-II regions of the 150 years old silk textile is given in Figure 6a in comparison with its second derivative profile. The second derivative of an absorption spectrum gives information about the position of the peaks and their half widths. As seen from the Figure 6, the absorbance maxima of each band component correspond to the minimum of the second derivative. The weak band at 1697cm-1 is assigned to C=O stretching vibration. Formation of carbonyl groups is a common signature of the occurrence of oxidation processes in natural macromolecules, which is formed upon peptide bond breakage [11]. The 1666cm-1 band is assigned to β-turn and 1628cm-1 band to β-sheet [10-11] structures. The amide II band components are revealed at 1545 and 1513cm-1 and are attributable to β-turn and β-sheet structures, respectively. The curve fitted amide I-II regions of the excavated silk textile (sample 3) is given in Figure 6b.
Figure 6:Curve fitted regions of sample 5 (150 years old silk) (a) 1750-1200cm-1 and sample 3 (archaeological silk). (b) 1760-1480cm-1 and -sh=-sheet; d.o=Disordered structure.
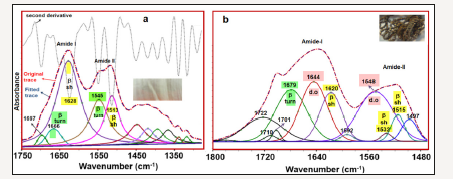
The curve fitting analysis reveals three band components, at 1679, 1644 and 1619cm-1 which can be attributable to amide I structures. The 1679cm-1 band is characteristic of the β-turn structure. The 1644cm-1 band can be attributed to dis-ordered [12-14] and 1620cm-1 to β-sheet [10] conformations. The 1722, 1710 and 1701cm-1 band components are assigned to C=O stretching vibrations of the carbonyl groups [11]. The amide II band components of the excavated silk (sample 3) are revealed at 1548, and 1532 and 1515cm-1 and are attributable to disordered, β-sheet and β-sheet structures, respectively. Comparison of amide I-II region of sample 5 with that of sample 3 indicated that β-sheet contribution was decreased in favor of disordered and β-turn structures. The crystalline regions of the silk protein polymer have β-sheet conformation and upon degradation an increase in disordered structure was previously observed [11]. Thus, our results indicate that sample 3 degraded more than sample 5 (Figure 6).
The integrated intensity ratios of A β-sheet/A(disordered+β-turn) measured from the curve fitted ATR-FTIR spectra and defined as IR crystallinity index, X, and used to define the degradation stages of the silk textiles [11]. The lower the index X, the lower the ratio of crystalline regions, would be in a specific degraded silk fibre. The IR crystallinity index X found to be decreased in the order sample No 6> sample No 5> sample No 3> sample No 2> sample No 1> sample No 4. Thus, the degradation degrees of the silk textiles have the reverse order (4>1>2>3>4>6) The oxidation degree decrease of the samples was also found to follow the same sequence.
Conclusion
We conclude the followings:
A. The excavated textile samples have metal ornaments. Precious metals have been used for the decoration of textiles since ancient times to create luxury objects for the secular and religious elite. The EDS analysis of the metal ornaments indicated that they were silver-coated copper.
B. Signature peak for sericin at 1112cm-1 [1,2] was observed only in the IR spectra of the excavated textiles indicating that these textile specimens were made of partially degummed raw silk.
C. Formation of carbonyl groups is a common signature of the occurrence of oxidation processes in natural macromolecules.
D. The degradation degrees of the investigated samples decrease, in the order 4>1>2>3>4>6. The oxidation degree decrease of the samples was also found to follow the same sequence
Acknowledgement
Author thanks Professor Sait Basaran and Dr Banu Cakan from Istanbul Univ. for providing her the excavated textiles. She is also grateful to Professor Ayse Erol and Mr. Furkan Kuruoglu for recording the FIBS-SEM images.
References
- Akyuz S, Akyuz T, Cakan B, Basaran S (2014) Investigations of the historic textiles excavated from Ancient Ainos (Enez – Turkey) by multiple analytical techniques. Journal of Molecular Structure 1073: 37-43.
- Kavkler K, Gunde CN, Zalar P, Demsar A (2011) FTIR spectroscopy of biodegraded historical textiles. Polymer Degradation and Stability 96(4): 574-580.
- Li MY, Zhao Y, Tong T, Hou XH, Fang BS, et al. (2013) Study of the degradation mechanism of Chinese historic silk (Bombyx mori) for the purpose of conservation. Polymer Degradation and Stability 98(3): 727-735.
- Goormaghtigh E, Cabiaux V, Ruysschaert JM (1994) Determination of soluble and membrane protein structure by fourier transform infrared spectroscopy, I. assignments and model compounds. In: Hilderson HJ, Ralston GB (Eds.), Subcellular Biochemistry, Springer, Germany, pp. 329-362.
- Basaran S (2002) Excavation and restoration work at Enez (Ainos) in 2001. In: Donmez S (Ed.), Anatolian Research, Letters Faculty Press, Istanbul, Turkey, p. 59.
- Karapanagiotis I, Mantzouris D, Kamaterou P, Lampakis D, Panayiotou C (2011) Identification of materials in post-Byzantine textiles from Mount Athos. Journal of Archaeological Science 38(12): 3217-3223.
- Monti P, Freddi G, Arosio C, Tsukada M, Arai T, et al. (2007) Vibrational spectroscopic study of sulphated silk proteins. Journal of Molecular Structure 834-836: 202-206.
- Bhat NV, Nadiger GS (1980) Crystallinity in silk fibers-partial acid-hydrolysis and related studies. Journal of Applied Polymer Science 25(5): 921-932.
- Liu J, Guo D, Zhou Y, Wu Z, Li W, et al. (2011) Identification of ancient textiles from Yingpan, Xinjiang, by multiple analytical techniques. Journal of Archaeological Science 38(7): 1763-1770.
- Barth A, Zscherp C (2002) What vibrations tell about proteins. Q Rev Biophys 35(4): 369-430.
- Koperska MA, Lojewski T, Lojewska J (2015) Evaluating degradation of silk’s fibroin by attenuated total reflectance infrared spectroscopy: Case study of ancient banners from Polish collections. Spectrochimica Acta Part A: Molecular and Biomolecular Spectroscopy 135: 576–582.
- Goormaghtigh E, Ruysschaert JM, Raussens V (2006) Evaluation of the information content in infrared spectra for protein Secondary Structure Determination. Biophys J 90: 2946–2957.
- Garside P, Wyeth P (2007) Crystallinity and degradation of silk: correlations between analytical signatures and physical condition on ageing. Applied Physics A 89: 871–876.
- Mauerer A, Lee G (2006) Changes in the amide IFT-IR bands of poly-L-lysine on spray-drying from a-helix, b-sheet or random coil conformations. Eur J Pharm and Biopharm 62(2): 131-142.
© 2019 Sevim A. This is an open access article distributed under the terms of the Creative Commons Attribution License , which permits unrestricted use, distribution, and build upon your work non-commercially.
 a Creative Commons Attribution 4.0 International License. Based on a work at www.crimsonpublishers.com.
Best viewed in


.jpg)


 Editorial Board Registrations
 Submit your Article
 Refer a Friend
 Advertise With Us
.jpg)


.jpg)


.bmp)
.jpg)
.png)
.jpg)


.jpg)


.png)

.png)


.png)


