
- About Us
- Guidelines
-

The Author ensures that the research has been conducted responsibly and ethically with adherence to all relevant regulations. read more..
- For Authors
- For Reviewer
- Manuscript Guidelines
- Membership
-
- Journals
- Reprints
- e-Books
- Videos
- Indexing
- Contact Us
 COVID-19
- Submissions


Full Text
Novel Research in Sciences
A First Report on Static Grain Growth Kinetics in An Ultralight Mg-8.41li- 1.81al-1.77zn Alloy Subjected to Friction Stir Processing
Furong Cao1,2*, Guoqiang Xue1,3 and Bijin Zhou1,4
1Department of Materials Science and Engineering, Northeastern University, PR China
2State Key Laboratory of Rolling and Automation, Northeastern University, PR China
3Xi’an Super crystal Science and Technology Development Co., Ltd., PR China
4School of Mechanical Engineering, Suzhou University of Science and Technology, PR China
*Corresponding author:Furong Cao, Department of Materials Science and Engineering, Northeastern University, PR China
Submission: August 23, 2022;Published: September 15, 2022
.jpg)
Volume12 Issue1September , 2022
Abstract
Friction stir processing is one of the severe plastic deformation methods. Static grain growth study during friction stir processing does not receive enough attention compared to dynamic recrystallization study. Thus, in this report on static grain growth kinetics of Mg-Li alloy, an ultralight Mg-8.41Li-1.80Al-1.77Zn alloy has been fabricated by rolling, friction stir processing, and annealing. Microstructural examination of the nugget zone in the annealed state revealed that the grain growth rates at 523 and 573K are much lower than the growth rate at 623K. In the meantime, grain growth prior to 30min is not obvious, but grains grow obviously with the increase in time after 30min. The nugget zone grain growth kinetics equation abided by parabolic relation based on the linear fitting of the experimental grain sizes. The grain growth activation energy was 176.191kJ/mol, higher than the lattice diffusion activation energy of magnesium, 135kJ/mol. Probable cause is that the second phase particles increase the difficulty of thermal activation and raise the activation energy. The calculation error between theoretical grain growth model and experimental grain growth model is two orders of magnitude because of the use of an effective diffusivity. Hence, accurate theoretical model for static grain growth remains to be established in the future. This indirectly demonstrates the scientific meaning and value of our established experimental parabolic growth model.
Keywords: Magnesium-lithium alloy; Friction stir processing; Annealing; Static grain growth; Microstructure
Introduction
Mg-Li alloy is the lightest nontoxic metallic alloy. Due to extremely low density, excellent specific stiffness, good specific strength, good damping property, and electromagnetic shielding performance, Mg-Li alloy has the potential for applications in aerospace, military weapons, 3C products, and automobile manufacturing fields. Thus, study on Mg-Li alloy has drawn much attention from extensive researchers [1-7]. Not only room temperature mechanical properties, corrosion performance, and microstructures [1,4-6] but also high temperature behavior and microstructure [2,3,7] were investigated. Because of good comprehensive mechanical properties of two-phase Mg-Li alloys, we designed an Mg-8Li-2Al-2Zn (designated as LAZ822) alloy. The purpose of 8 wt %Li addition is to obtain a two-phase alloy. The purpose of 2 wt % Al addition is to achieve solid solution strengthening and second phase strengthening. The purpose of 2wt% Zn addition is to achieve solid solution strengthening. Friction Stir Processing (FSP) is a further development of friction stir welding and one of the Severe Plastic Deformation (SPD) approaches. According to literature survey, FSP of Mg-Li alloys has been reported in several alloys [8-10]. The research aspect includes ambient mechanical properties, corrosion behavior, and microstructures [8] and high temperature mechanical properties and microstructures [9,10] during FSP. Thermal stability issue is often accompanied by SPD process. When the ultrafine-grained and fine-grained alloys are exposed to high temperature, grain coarsening often occurs. Some grain growth reports and review containing modelling and experimental microstructures were documented [11-14]. To the best of our knowledge, no information has been known about the study on the static grain growth behavior in Mg-Li alloy. Thus, it is necessary to work out this report on static grain growth in Mg-Li alloy. In this work. our investigated contents include four aspects: (i) to fabricate LAZ822 alloy by casting, rolling, FSP, and annealing; (ii) to investigate or characterize its annealing microstructure; (iii) to investigate its grain growth kinetics; (iv) to compare established experimental grain growth equation and theoretical grain growth equation. It is hoped that this first report about static grain growth in Mg-Li alloy processed by FSP stimulates the interests of extensive Mg-Li researchers.
Experimental procedures
The present LAZ822 alloy ingot was obtained by melting and casting process like the process of Mg-9.3Li-1.79Al-1.61Zn alloy ingot, as shown elsewhere in detail [15]. The analyzed chemical composition of this alloy was 8.41 mass %Li, 1.80 mass %Al, 1.77 mass %Zn and balanced Mg. The ingot was homogenized at 473 K for 20h. After milling of the ingot surfaces, the billet with the dimensions of 24mm×90mm×170mm was held at 573K for 2h. Then the billet was hot rolled at 573K for 12 passes to 6mm thickness with a percent reduction of 75%. The schematic diagram of FSP principle was shown in [10]. A rotating tool was inserted into the plate to cause intense plastic deformation at elevated temperature and achieve microstructural modification. FSP was conducted on the hot rolled plate. Water spray cooling in the working position of the plate was the cooling mode. The diameter of conical pin was 8mm. The rotational speed of the stirring head was 800rpm. The transverse speed of the stirring head was 45mm/ min. The rolled samples were annealed at 523, 573, and 623K for 10-200min. To observe the optical microstructure, the specimens were mechanically ground and polished by abrasive papers from 100# to 3000#. The etched solution was 10% HCl+90% alcohol. After etched, the specimens were rinsed by alcohol and dried by a hair drier. Olympus DSX500 optical microscope was used for the examination. Grain sizes were measured by Image-Pro Plus (IPP) software to characterize the microstructures.
Result and Discussion
Experimental static grain growth after FSP
Figures 1-3 display the nugget zone microstructures of FSP LAZ822 alloy annealed at temperatures of 523, 573, and 623K for holding times of 10,30 and 60min. The white phase is Hexagonal Closed-Packed (HCP) structured α-Mg solid solution phase while the yellow phase is Body-Centered Cubic (BCC) structured β-Li solid solution phase. Hence, this alloy is a two-phase alloy. It is noted that grain size increases with the rise in temperature. This is because increased temperature accelerates atomic diffusion and boundary migration, and boundary migration results in grain growth. In particular, the grain sizes at 573 and 623K differ greatly, indicating that the grain size is very sensitive to the temperature. Figure 4 presents the nugget zone microstructures of FSP LAZ822 alloy annealed at 623K for different holding times. Grains grow with the increase in holding time. Table 1 presents the grain sizes after annealing at different temperatures and holding times. According to Figure 1-4, and Table 1, grain size is very sensitive to annealing temperature and holding time. Figure 5 presents the variation in grain sizes of LAZ822 alloy with different temperatures and times. It is seen that grain size increases with the temperatures. The growth rates, the slope of the curves, at 523 and 573K are much lower than the growth rate at 623K. In the meantime, grain growth prior to 30min is not obvious, but grains grow obviously with the increase in time after 30min.
Table 1: Grain sizes after annealing at different temperatures and holding times.

Figure 1: Nugget zone microstructures of FSP LAZ822 alloy annealed at different temperature for holding time of 10min: (a) 523K; (b) 573K; (c) 623K.

Figure 2: Nugget zone microstructures of FSP LAZ822 alloy annealed at different temperature for holding time of 30min: (a) 523K; (b) 573K; (c) 623K.

Figure 3:Nugget zone microstructures of FSP LAZ822 alloy annealed at different temperature for holding time of 60min: (a) 523K; (b) 573K; (c) 623K.

Figure 4:Nugget zone microstructures of FSP LAZ822 alloy annealed at 623K for different holding times: (a)30min; (b)60min; (c)100min; (d)150min.

Figure 5:Variation in grain sizes of LAZ822 alloy with different temperatures and times.

Establishment of grain growth kinetics models according to experimental data
Static grain growth kinetics model is given by the following form:
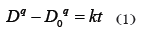
where D and D0 are the average grain size after holding time t, and initial grain size before annealing, respectively; k is the grain growth factor, and q is the grain growth exponent, relevant to the mechanism controlling the grain growth.
Differentiating Eq. (1) by time t, one gets
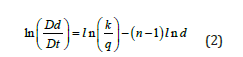
According to Table 1, ln (dD/dt)-ln (D) curves can be plotted and hence k and q can be obtained. Figure 6 presents the ln (dD/dt)- ln (D) curves of FSP and annealed LAZ822 alloy. q values at 523,573 and 623K are equal to 2. Thus, the grain growth abides by parabolic curve. Generally, q values are 2,3,4,5, and 6 for conventional alloys. Large q values mean lower growth rate. In the present alloy, q=2 means pronounced grain growth.
Figure 6:ln (dD/dt)-ln (D) curves of FSP and annealed LAZ822 alloy.

Thus, the static grain growth models were established as follows:
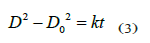
where k values are 0.075, 0.299 and 3.69μm2/min at 523, 573
and 623K, respectively.
k value is given by
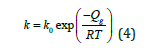
Figure 7:-1000/T curve of FSP and annealed LAZ822 alloy.

where k0 is a constant, R is the universal gas constant, 8.314 J/ mol•K and T is the absolute temperature in Kelvin. Figure 7 presents the -1000/T curve of FSP and annealed LAZ822 alloy. The slope of fitted curve is 21.192. Thus, the grain growth activation energy, Qg, is calculated as the following: Qg=21.192×8.314×1000=176.191kJ/ mol. This experimental grain growth activation energy of 176.191 kJ/mol is higher than the lattice diffusion activation energy of magnesium, 135 kJ/mol [16]. Probable cause is that the second phase particles obstruct the movement of grains and increase the difficulty of softening such as annealing after FSP. In other words, the second phase particles increase the difficulty of thermal activation and raise the activation energy.
Analysis and comparison of theoretical and experimental static grain growth equations
Theoretical static grain growth model for parabolic growth curve is given by [17]

where d is the grain size after holding time of t; d0 is the initial grain size for t=0 s; γ is the grain boundary surface tension; Ω is the atomic volume; W is the grain boundary width, W=2b, here, b is the magnitude of Burgers vector; Dgb is the grain boundary diffusivity; kB is Boltzmann’s constant; k is the growth factor. An estimation is made for 573K×60min situation. T=573K, t=3600 s, d=3.45μm, d0=1.52μm, γ=1Jm-2 [18], b=3.21×10⁻¹⁰m [19], Ω=0.7b3=2.315×10⁻²⁹m3, Dgb=6.34×10⁻¹¹m2s-1 [20], kB=1.38×10- 23JK-1. The theoretical k value is 1.16×10⁻⁹m2 s-1 while the experimental k value is 2.66×10⁻¹⁵ m2 s-1. This indicates a big difference. This is because the diffusion process is not a grain boundary diffusion process, but a lattice diffusion dominated process. Further estimation is made using an effective diffusivity in [21]. Deff=DL+(W/d) Dgb, where Deff is the effective diffusivity and DL is the lattice diffusivity. DL=4.27×10⁻¹⁵m2 s-1 according to our previous model [20]. The theoretical k value is 2.93×10⁻¹³m2s-1 while the experimental k value is 2.66×10⁻¹⁵m2s-1. The calculation error between theoretical model and experimental model becomes a little bit closer and is two orders of magnitude because of the use of an effective diffusivity. Hence, accurate theoretical model for static grain growth remains to be established in the future. As [22,23] pointed out in their articles published in 1988 and 2002, respectively, that a unified accurate grain growth model still was not available although much effort has been made across the world. Our calculated results confirm what they said. This indirectly demonstrates the scientific meaning and value of our established experimental parabolic growth model.
Conclusion
An ultralight Mg-8.41Li-1.80Al-1.77Zn alloy has been fabricated by rolling, friction stir processing, and annealing. Microstructural examination of the nugget zone in the annealed state revealed that the grain growth rates at 523 and 573K are much lower than the growth rate at 623K. In the meantime, grain growth prior to 30min is not obvious, but grains grow obviously with the increase in time after 30min. The nugget zone grain growth kinetics equation abided by parabolic relation based on the linear fitting of the experimental grain sizes. The grain growth activation energy was 176.191kJ/mol, higher than the lattice diffusion activation energy of magnesium, 135kJ/mol. Probable cause is that the second phase particles increase the difficulty of thermal activation and raise the activation energy. The calculation error between theoretical grain growth model and experimental grain growth model is two orders of magnitude because of the use of an effective diffusivity. Thus, accurate theoretical model for static grain growth remains to be established in the future. This indirectly demonstrates the scientific meaning and value of established experimental parabolic growth model.
References
- Cao Furong, Sun Chaofeng, Shang Huihui, Xiang Chao, Liu Renjie (2021) Microstructure evolution and mechanical properties in an ultralight Mg-2.76Li-3Al-2.6Zn-0.39Y alloy. Materials Science and Engineering A 822: 141680.
- Cao Furong, Ding Xin, Xiang Chao, Shang Huihui (2021) Flow stress microstructural evolution and constitutive analysis during high-temperature deformation in Mg-4.4Li-2.5Zn-0.46Al-0.74Y alloy. Acta Metallurgica Sinica 57(7): 860-870.
- Dutkiewicz Jan, Kalita Damian, Maziarz Wojciech, Faryna Marek (2020) Superplastic deformation of Mg-9Li-2Al-0.5Sc alloy after grain refinement by kobo extrusion and cyclic forging. Archives of Civil and Mechanical Engineering 20: 121.
- Wang Guowei, Song Dan, Li Cheng, Klu Edwin Eyram, Qiao Yanxin, et al. (2019) Developing improved mechanical property and corrosion resistance of Mg-9Li alloy via solid-solution treatment. Metals 9(9): 920.
- He Yuqing, Peng Chaoqun, Feng Yan, Wang Richu, Zhong Jianfeng (2020) Effects of alloying elements on the microstructure and corrosion behavior of Mg-Li-Al-Y alloys. Journal of Alloys and Compounds 834: 154344.
- Kang ZX, Lin K, Zhang JY (2016) Characterisation of Mg-Li alloy processed by solution treatment and large strain rolling. Materials Science and Technology 32(5): 498-506.
- Li Yi, Guan Yanjin, Zhai Jiqiang, Lin Jun (2019) Hot deformation behavior of LA43M Mg-Li alloy via hot compression tests. Journal of Materials Engineering and Performance 28: 7768-7781.
- Liu G, Ma ZD, Wei GB, Xu TC, Yang Y, et al. (2019) Microstructure, tensile properties and corrosion behavior of friction stir processed Mg-9Li-1Zn alloy. Journal of Materials Processing Technology 267: 393-402.
- Liu FC, Tan MJ, Liao J, Ma ZY, Meng Q, et al. (2013) Microstructural evolution and superplastic behavior in friction stir processed Mg-Li-Al-Zn alloy. Journal of Materials Science 48: 8539-8546.
- Cao Furong, Xue Guoqiang, Zhou Bijin, Wang Shuncheng (2019) High-temperature deformation behavior of duplex Mg-8.41Li-1.80Al-1.77Zn alloy processed by friction stir processing. Metals and Materials International 25(3): 570-583.
- Rofman Oleg V (2018) Deformation-induced changes in single-phase Al-0.1Mg alloy. Philosophical Magazine 98 (23): 2120-2134.
- Hyde K B, Bate P S (2005) Dynamic grain growth in Al-6Ni: modelling and experiment. Acta Materialia 53(16): 4313-4321.
- Kim Byung-Nam, Hiraga Keijiro, Sakka Yoshio, Ahn Byung-wook (1999) A grain-boundary diffusion model of dynamic grain growth during superplastic deformation. Acta Materialia 47(12): 3433-3439.
- Najafkhani Fateme, Kheiri Sara, Pourbahari Bita, Mirzadeh Hamed (2021) Recent advances in the kinetics of normal/abnormal grain growth: a review. Archives of Civil and Mechanical Engineering 21(29): 1163.
- Cao Furong, Xia Fei, Hou Hongliang, Ding Hua, Li Zhiqiang (2015) Effects of high-density pulse current on mechanical properties and microstructure in a rolled Mg-9.3Li-1.79Al-1.61Zn alloy. Materials Science and Engineering A 637(18): 89-97.
- Frost HJ, Ashby MF (1982) Deformation-mechanism maps: the plasticity and creep of metals and ceramics. Pergamon Press.
- Sherwood DJ, Hamilton CH (1991) A mechanism for deformation-enhanced grain growth in single phase materials. Scripta Metallurgca et Materialia 25(12): 2873-2878.
- Chokshi AH (2005) Cavity nucleation and growth in super plasticity. Materials Science and Engineering A 410-411: 95-99.
- Friedel J (1964) Dislocations. Pergamon Press.
- Cao FR, Ding H, Li YL, Zhou G, Cui JZ (2010) Super plasticity, dynamic grain growth and deformation mechanism in ultralight two-phase magnesium-lithium alloys. Materials Science and Engineering A 527(9): 2335-2341.
- Senkov ON, Myshlyaev MM (1986) Grain growth in a superplastic Zn-22%Al alloy. Acta Metallurgica 34(1): 97-106.
- Atkinson HV (1988) Theory of normal grain growth in pure single-phase systems. Acta Metallurgica 36(3): 469-491.
- Baldan A (2002) Progress in Ostwald ripening theories and their applications to nickel base superalloys Part I: Ostwald ripening theories. Journal of Materials Science 37(11): 2171-2202.
© 2022 Furong Cao. This is an open access article distributed under the terms of the Creative Commons Attribution License , which permits unrestricted use, distribution, and build upon your work non-commercially.
Editor In Chief


.jpg)


Signup for Newsletter

Quick Links
 Editorial Board Registrations
 Submit your Article
 Refer a Friend
 Advertise With Us
Our Recent Edition

.jpg)


Top Editors


.jpg)


.bmp)
.jpg)
.png)
.jpg)


.png)

.png)


.png)


Financial Support

Sponsors

Latest e-Books

Latest Video

 a Creative Commons Attribution 4.0 International License. Based on a work at www.crimsonpublishers.com.
Best viewed in
a Creative Commons Attribution 4.0 International License. Based on a work at www.crimsonpublishers.com.
Best viewed in