- Submissions

Full Text
Environmental Analysis & Ecology Studies
Response of Primary Production and Physiochemical Properties to Nutrients: A Mesocosm Experiment
Teklit Gebregiorgis*
Department of Chemistry, Mekelle University, Ethiopia
*Corresponding author: Teklit Gebregiorgis, Department of Chemistry, Mekelle University, Ethiopia
Submission: February 15, 2018;Published: April 20, 2018

ISSN 2578-0336 Volume2 Issue2
Abstract
Eutrophication is one of the major problems facing aquatic systems over the world. Currently, nutrient inputs to aquatic ecosystems have been studied in different parts of the globe. In the present study, a mesocosm experiment was conducted to investigate the effect of dissolved nutrients on primary production and physicochemical properties of tap water in Mekelle Tigray Ethiopia. Four containers with four replicate water samples were collected from a Mekelle canal and one was enriched with Nitrogen (N), one with phosphorous (P), one with both nutrients, one control without any nutrients added. Data on primary production and physiochemical properties of canal water were analyzed using one-way ANOVA with R-software. The result shows that the effect of N and P input on primary production and physiochemical properties of the mesocosm experiment were statistically significant. In particularly, Nitrogen was the limiting factor in the net primary production, periphyton, pH and dissolved oxygen of the water. According to the result of this experiment, it is important to do further investigation for better understanding the effect of nutrient input on an aquatic ecosystem.
Keywords: Mekelle; Eutrophication; Mesocosm; Nutrient; Primaryproduction; Physiochemical properties
Introduction
Eutrophication is one of the major problems facing aquatic systems over the world. Currently, several lakes around the globe are suffering from eutrophication. Some of the drivers are population growth, economic growth, energy consumption and fertilizer application [1]. Besides the various drivers of eutrophication, increase nutrient loading to lakes from anthropogenic activities take the largest share than nutrients added from a natural process [2]. Hence, prevention of the aquatic system from eutrophication has become attractive to limnologists, estuarine and water managers which is still a great challenge for them [3]. Literature in the field based on in situ experiment on lakes show that availability of phosphorus in the aquatic ecosystem was affected by the competitive effects of periphyton and seston that could substantially reduce phytoplankton biomass [4,5].
Furthermore, Nitrogen (N) limits net primary production (NPP) in terrestrial ecosystems [6]. According to Howarth et al. [6], the experiment in the terrestrial ecosystem for NPP, Nitrogen was the limiting factor. With the availability of Nitrogen (N) and phosphorus (P) on the aquatic ecosystem, there are different perceptions among researchers. According to Menge et al. [2], P and N are the key nutrients that determine primary production in the aquatic system. Besides, though P and N are key determinants ofprimary production in the aquatic system, there is no evidence for the similarity in the concentration of these nutrients, Howarth et al. [6]. The increase in the productivity of phytoplankton affects the physicochemical properties of the aquatic ecosystem. For example, dissolved oxygen potentially increases throughout the daytime because of the process of photosynthesis that allows discharge of oxygen from phytoplankton. Furthermore, the alkalinity of water increases when phytoplankton consumes CO2, which leads to increase pH and electrical conductivity of water. The same finding was indicated by Dejenie et al. [5]. However, there is not a universal consensus among the scholars in the field and the issue has remained a contemporary scientific debate. Therefore, mesocosm investigation was carried out in tap water to understand the effect of nutrients on primary production and physiochemical properties thereby, contributes to the ongoing debate.
Materials and Methods
Experimental design
In this work, in order to investigate the input of nutrient on primary production and physiochemical properties, water sample from the back side of Mekelle university on street called kebelle 18 and tap water from the laboratory was used to develop a mesocosm experiment having 4 treatments with 4 replications for each treatment on 16 plastics (65x45x40cm) volume 86 liters was designed for the experiment that was placed on aquatic ecology lab roof (Table 1). In each container, macrophytes of Myriophyllum sp. was placed with 9 glass slides as a surface for periphyton colonization [7].
Table 1: Mesocosm experimental design used.

Laboratory analysis
Physiochemical analysis: The physiochemical properties of surface water were examined following the procedure described in Gettel et al. [7]. The following parameters were assessed: pH, dissolved oxygen and temperature measured from containers placed on aquatic ecology lab roof for three weeks using properly calibrated the portable meter. To analys elight extinction (turbidity) 100mL unfiltered water from containers was sampled and examined in the laboratory using a spectrophotometer. Similarly, 100mL water was used from containers, filtered using a Millipore filtering system and was analyzed for dissolved inorganic phosphate, nitrate, and ammonia, and was measured using Lange-Hach test kits [7].
Primary production: To analyze the gross primary production and net primary production., samples were prepared with a light bottle for determining photosynthesis and dark bottle for determining respiration then the gross primary production rate was analyzed by summing the oxygen produced during the light with the oxygen consumed during the dark [7].
Biomass: To investigate the biomass in terms of the ash-free dry weight, samples were filtered using pre-combusted What man GF/C glass fiber filters, dried overnight at 105 °C, re-weighed, ashed at 400 °C for 2h and final weights were recorded [7].
Chlorophyll: To measure for periphyton and seston chlorophyll-a concentration, the filtering procedure was followed using 1000mL sample of water and placed in a freezer for one day. According to the procedures described in [7], 25mL of 80% of ethanol was added and heated in a water bath, then cooled and centrifuged. The clear liquid was decanted to the test tube and its absorbance was measured using a spectrophotometer at 665nm and 750nm wavelength. In addition to measuring the extinction by adding 0.05mL of HCl to the extracted sample and was measured using a spectrophotometer at 665nm and 750nm wavelength.
Data Analysis
The nutrient treatment differences in concentrations and the response variables (Gross primary productivity, Net primary productivity, seston chlorophyll-a, physiochemical properties like pH, DO, light extinct coefficient and periphyton chlorophyll-a, seston and periphyton ash free dry weight - AFDM) were analyzed statistically using one-way ANOVA R-package software. All treatment effects were considered to be significant at P<0.05.
Results
Gross and net primary production
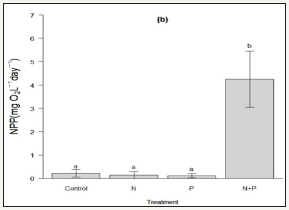
The result of net primary production and gross primary production shows variation among different treatment groups. Gross primary production and net primary production were the highest in the treatment with N+P (83.5.±9.3mg O2L-1 day-1), (4.3±1.0mg O2L-1 day-1), respectively (Figure 1a & 1b). On the other hand, the lowest gross primary production (5.0.7±2.1mg O2L-1 day-1) was observed in the control treatment while in net primary production (0.1±0.1mg O2L-1 day-1) was observed in both N and P treatment only. The result of ANOVA in Table 2 showed that there is no statistical difference among different treatment groups in gross primary production [F(3,12)=3.085, P=0.07]. However, there is a statistical difference among different treatment groups in net primary production [F(3,12)=11.05, P=0.00] with regard to the Tukey post hoc test showed a statistically significant difference of N+P with N, P and control treatments.
Figure 1: Average GPP (mean±standard error).
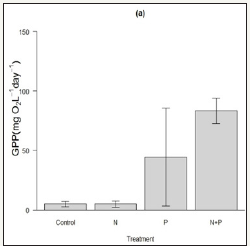
Figure 2: Average NPP (mean±standard error) under different treatments. The error bar represents standard error and letters denoted on error bars shows (Tukey’s HSD, p<0.05).
Biomass and chlorophyll-a
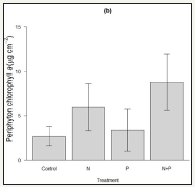
The biomass and chlorophyll-a concentration of seston showed difference among treatment groups. Seston biomass and seston chlorophyll-a were the highest in the treatment with N+P (55.50±17.71mgL-1), (521.14±173.73ugL-1), respectively (Figure 2a & 2b). In contrast, the lowest seston biomass was observed in the treatment with control (4.76±1.76mgL-1) while in seston chlorophyll-a was observed with P treatment only (12.88±5.27ugL- 1). Anova Table 2 [F(3,12)=5.656, p=0.01], [F(3,12)=5.939, P=0.01]), showed that there is a statistical difference among different treatment groups in seston biomass and seston chlorophyll-a. However, with regard to seston biomass and chlorophyll-a Tukey post hoc test showed a statistically significant difference between pairs of N+P with N, P and control treatments. In the same manner, periphyton biomass and chlorophyll-a concentration result showed variation among different treatment groups. Periphyton biomass and periphyton chlorophyll-a were the highest in the treatment with N+P (0.15±0.05mgcm-2), (8.77±2.74ug/cm-2), respectively (Figure 3a & 3b). On the contrary, the lowest periphyton biomass and periphyton chlorophyll-a were observed in the control treatment (0.09±0.01mgcm-2), (2.66±0.95ug/cm-2), respectively. Anova table [F(3,12)=0.19, p=0.90], [F(3, 12)=1.281, P=0.33] showed that there is no a statistical difference among different treatment groups in Periphyton biomass and periphyton chlorophyll-a.
Table 2: One-way ANOVA summary of primary production parameters.
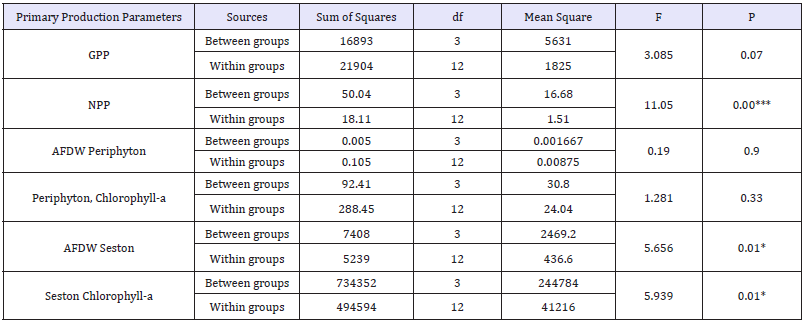
Sig codes: 0‘***’0.001‘**’0.01‘*’0.0 ‘.’0.1‘’1
Figure 3: Average seston biomass (mean±standard error).
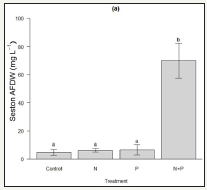
Figure 4: Average seston chlorophyll-a (mean±standard error) under different treatments. The error bar represents standard error and letters denoted on error bars shows (Tukey’s HSD, p<0.05).
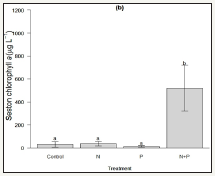
Figure 5: Average periphyton biomass (mean±standard error).
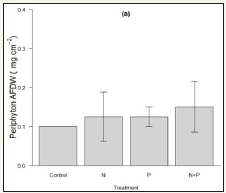
Figure 6: Average periphyton chlorophyll-a (mean±standard error) under different treatments. The error bar represents standard error and letters denoted on error bars shows (Tukey’s HSD, p<0.05).
Physicochemical properties
With regard to physiochemical properties, the results showed that there was variation under different treatments. The pH and DO were the highest in the treatment with N+P (10.88±0.07) and DO (23.10±0.84mgL-1), respectively (Figure 4a & 4b). Contrary to this, the lowest pH (8.99±0.30) and DO (13.24±1.09mgL-1), respectively were observed in the treatment with N only. The result of ANOVA in Table 3 showed that there was a statistical difference among different treatment groups in pH [F (3,12)=18.54, p=0.00008] and DO [F (3,12)=22.88, P=0.00]. However, with regard to pH Tukey post hoc test, the result showed a statistically significant difference between treatment pairs of N+P with control, N treatment, and P with N treatment. Similarly, Tukey post hoc test showed a statistically significant difference on DO between pairs of N+P with control, N and P treatments. Concerningthelight extinction coefficient properties of the canal water, the result showedthat the highest light extinction coefficient (38.94±1.42m-1) was observed in the treatment with N+P. Unlike to the above, the lowest light extinction coefficient (2.68±1.02m-1) was observed in the treatment with control (Figure 5). Anova table [F (3,12)=120.1, P=0.00] showed that there was a statistical difference among different treatment groups. However, with regard to Tukey post hoc test, the outcome showed a statistically significant difference between pairs of N+P with control, P and N treatments.
Table 2: Summary of one-way ANOVA for physicochemical properties.

Sig codes: 0‘***’0.001‘**’0.01‘*’0.05‘.’0.1‘’1
Figure 7: Average pH (mean±standard error).
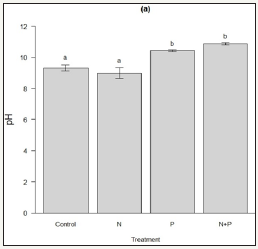
Figure 8: Average DO (mean±standard error) under different treatments. The error bar represents standard error and letters denoted on error bars shows (Tukey’s HSD, p<0.05).
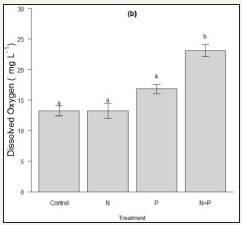
Figure 9: Average light extinct coefficient (mean ± standard error) under different treatments. The error bar represents standard error and letters denoted on error bars shows (Tukey’s HSD, p<0.05).

Discussion
The results presented indicate the existence of strong effect of nutrient input on primary production and physiochemical properties of water. Gross primary production, net primary production, the biomass of periphyton and seston show that there is a larger increase on N+P treatments with Nitrogen limitation. Likewise, a similar result was reported by Menge et al. [2]. In their overall experiments, they found out that the highest biomass increases occurred in the Nitrogen+Phosphorus treatment and the lowest occurred in the controlled treatment. Taken together, these results suggest that the increase in the biomass of phytoplankton is due to primary nutrient supply [2]. In addition to this, the concentration of chlorophyll-a of seston and periphyton, was higher in treatments which contain N+P nutrients with phosphorus limitation as similar finding was reported by Jeppesen et al. [8].
They suggested that in addition to the input of the nutrients, the temperature of the season have an impact on the increase of chlorophyll concentration. They also suggest that sestonic chlorophyll-a is a poor indicator for assessing nutrient-related problems in a mesocosm experiment when they compared it with periphyton chlorophyll-a. Asimilar result was also reported by Nardelli et al. [9]. The results of physicochemical properties showed that there was high pH concentration in N+P treatment with nitrogen limitation. Photosynthesis allows discharge of oxygen from phytoplankton. Furthermore, the alkalinity of water increases when phytoplankton consumes CO2, which leads to increase pH and electrical conductivity of water [5]. On the other hand, light extinction and dissolved was higher in N+P treatments with nitrogen limitation whichwere attributed by the concentration of algal bloom resulted from nutrient addition which blocks incoming solar radiation that affects light extinction coefficient and Dissolved Oxygen. A similarfindingwas also reported by Dejenie et al. [5].
Conclusion and Recommendation
In this study, the effect of nutrients on Mekelle surface water was analyzed. The effect of nutrients on primary production and physiochemical properties in aquatic ecosystem was very complex and needs a better investigation. This experiment showed that N and P were main limiting factor that affects t physiochemical properties, phytoplankton production, chlorophyll-a concentration of periphyton and seston of canal water. Therefore, in order to determine which element was a limiting factor for phytoplankton production and physiochemical properties of aquatic ecosystem, furtherinvestigation should be done in depth and come out with sound findings and approaches to manage aquatic ecosystems.
References
- Smith VH, Joye SB, Howarth RW (2006) Eutrophication of freshwater and marine ecosystems. Limnology and Oceanography 51(1 Part 2): 351-355.
- Menge DN, Hedin LO, Pacala SW (2012) Nitrogen and phosphorus limitation over long-term ecosystem development in terrestrial ecosystems. PLoS One 7(8): 42045.
- Vadeboncoeur Y, Erik J, Jake VZ, Hans HS, Kirsten C (2003) From greenland to green lakes: Cultural eutrophication and the loss of benthic pathways in lakes. Limnology and Oceanography 48(4): 1408- 1418.
- Carpenter SR, Kitchell JF, Hodgson JR (1985) Cascading trophic interactions and lake productivity. Bio Science 35(10): 634-639.
- Tadesse D, Tsehaye A, Sarah R, Teklit G, Abreha G, et al. (2009) The impact of the fish Garra on the ecology of reservoirs and the occurrence of Microcystis blooms in semi‐arid tropical highlands: an experimental assessment using enclosures. Fresh water Biology 54(8): 1605-1615.
- Howarth R, Francis C, Daniel JC, Josette G, Scott CD, et al. (2011) Coupled biogeochemical cycles: eutrophication and hypoxia in temperate estuaries and coastal marine ecosystems. Frontiers in Ecology and the Environment 9(1): 18-26.
- Gettel G, Raj E, van DA, John S (2017) Aquatic ecosystem processes and application: experimental manipulation manual. IHE Delft Institute for Water Education, Delft, Netherlands.
- Erik J, Martin S, Jens PJ, Karl EH, Orlane A, et al. (2005) Lake responses to reduced nutrient loading-an analysis of contemporary long‐term data from 35 case studies. Freshwater Biology 50(10): 1747-1771.
- Nardelli SC, Twardowski MS (2016) Assessing the link between chlorophyll concentration and absorption line height at 676nm over a broad range of water types. Optics Express 24(22): 1374-1389.
© 2018 Teklit Gebregiorgis. This is an open access article distributed under the terms of the Creative Commons Attribution License , which permits unrestricted use, distribution, and build upon your work non-commercially.
 a Creative Commons Attribution 4.0 International License. Based on a work at www.crimsonpublishers.com.
Best viewed in


.jpg)


 Editorial Board Registrations
 Submit your Article
 Refer a Friend
 Advertise With Us
.jpg)


.jpg)


.bmp)
.jpg)
.png)
.jpg)


.png)

.png)


.png)


