
- About Us
- Guidelines
-

The Author ensures that the research has been conducted responsibly and ethically with adherence to all relevant regulations. read more..
- For Authors
- For Reviewer
- Manuscript Guidelines
- Membership
-
- Journals
- Reprints
- e-Books
- Videos
- Indexing
- Contact Us
 COVID-19
- Submissions


Full Text
Advancements in Civil Engineering & Technology
Assessment of Soil Liquefaction to a Highway Bridge Approach Embankment
Nazife Erarslan*
Civil Engineering, Engineering Faculty, Izmir Democracy University, Turkey
*Corresponding author:Nazife Erarslan, Civil Engineering, Engineering Faculty, Izmir Democracy University, Gursel Aksel Bulv. No: 14, Karabaglar, Izmir, Turkey
Submission: April 27, 2023;Published: June 14, 2023

ISSN: 2639-0574 Volume5 Issue5
Abstract
The Seyrek highway intersection bridge on the İzmir-Menemen-Aliağa Highway is the study site of this research and is located in the Menemen town of İzmir city in Turkey. It has been determined that deformations have occurred in the bridge piers and approach embankment at the Seyrek highway intersection bridge on the İzmir-Menemen-Aliağa Highway. There is an active stream starting from 830m southwest of the study area and passing 2km northwest of the study area and the groundwater level determined according to the borehole data is between 3.1 and 4.05m. The liquefaction potential of the study area was calculated using the “Simplified Method” approach in this study. The liquefaction potential of the project area was found to be between 3.80m and 10.5m in depth using laboratory and field tests. Moreover, no liquefaction potential was found after 10.5 meters despite the soil type being SM-SC with low SPT-N values. Therefore, the importance of the effects of grain properties such as the percentage of plastic fines, average grain diameter and plasticity index in liquefaction analysis based on the SPT-N number was also shown in this study. According to the settlement analyses, the time required for the total settlement to decrease to the allowable levels has been calculated as approximately 49.33 years and since the filling has been present for more than 7.5 years, the remaining settlement is above the allowable specification criteria. As a result, soil improvement and reinforcement methods such as DSM columns and drainage canals were advised to be used in Seyrek highway intersection bridge embankments in the study field to ensure the safety of the engineering projects against the damage caused by liquefaction and settlement in the study area.
Keywords:Liquefaction potential; Simplified method; Earthquake and liquefaction
Introduction
Figure 1:Destructions due to soil liquefaction (a) 1999 Kocaeli earthquake, Turkey (b) 2023 Kahramanmaraş earthquake, Turkey.

Liquefaction is explained as the loss of some or all the shear strength as a result of rising pore water pressure due to lack of adequate drainage and falling effective stress in loose cohesionless soils below the groundwater level due to the effect of cyclic shear stress because of earthquakes. Sudden loss of stiffness and strength reduction in the soil can lead to a decrease in bearing capacity, resulting in serious displacement on the ground and damage to the structure above the ground. This phenomenon, which is defined as liquefaction is one of the most important issues to be studied in geotechnical engineering [1-5]. The Kocaeli Earthquake and the Kahramanmaraş Earthquake of February 6, 2023, damages due to liquefaction led to partial life and mostly economic losses, respectively occurred in Turkey (Figure 1).
The saturated and loose soil particles tend to converge on each other due to the seismic waves generated during an earthquake. The stress at the contact points of the particles in this state is transmitted to the surrounding water. Since seismic waves cause sudden and very short-term movements during an earthquake, these waves do not allow sufficient time for the interparticle water to drain. Therefore, the pressure of pore water, which cannot move away from the soil particles, suddenly increases. This sudden increase in pore water destroys the contact forces that hold the soil particles together and separates the particles from each other. This behavior of the soil because of dynamic loads is defined as liquefaction. In this case, the soil that loses its strength starts to behave and move like a viscous liquid (Figure 2).
Figure 2:Liquefaction mechanism.

Soil improvement is implemented in cases where the soil is not able to meet one or more of the conditions such as bearing capacity, settlement or liquefaction. There are many soil improvement methods, including shallow and deep improvement techniques [6-9]. The most suitable method is chosen by considering the characteristics of the ground to be improved, the cost of the improvement method whether the improvement method is suitable for the desired purpose and the duration of the soil improvement method. Factors such as groundwater level, geological units, particle size and number of standard penetration tests (SPTs) in general constitute necessary conditions for liquefaction. The groundwater level is significant mostly in the first 3m and usually up to 20m. The geological soil units where liquefaction develops are saturated, silty sandy and clayey sandy units with low bearing capacity and located between the first 15m and 20m.
Site Investigations
Information of the study field
The Seyrek highway intersection bridge on the İzmir- Menemen-Aliağa Highway is the study field in this research and is located in the Menemen town of İzmir city, 7km away in the south of the center of the town (Figure 3). It is seen from the results of field observations, laboratory studies and previous geological studies in the project area that the area consists of Quaternary units. The floodplain sediments, most commonly observed on the Gediz River delta and south of the Menemen district, consist of fine sand intercalated with silt. There are neotectonic E-W striking normal faults and NW and NE oblique faults developed due to N-S striking stress tectonics in İzmir and its surroundings. There are many active fault zones in the west and south of İzmir, striking N-S, N-.NE and S-SW. İzmir has a Mediterranean climate according to the Köppen climate classification with warm winters and very hot and dry summers. The average highest temperature is 33.8 °C in July and the average lowest temperature is 6.0 °C in January. There is an active stream starting from 830m southwest of the study area and passing 2km northwest of the study area and the groundwater level determined according to the borehole data is between 3.1 and 4.05m.
Figure 3:Location of the study site.

Field and laboratory tests
A total of 160.00m of drilling was carried out in four different locations (SK-1, SK-2, SK-3, and SK-4) and 104 SPT samples were taken within the scope of the project. The soil profile and the crosssection of the project area are shown in Figure 4. The laboratory experiments were performed using the SPT samples, following international standards. The laboratory tests were carried out using the selected representative SPT specimens of the boreholes and the results of the laboratory and field tests are shown in Table 1.
Figure 4:Soil profile and cross-section of the bridge and abutments.

Table 1:The laboratory and site test results.

Geotechnical Evaluations of the Study Field
It has been determined that deformations have occurred in the bridge piers and approach embankment at the Seyrek highway intersection bridge on the İzmir-Menemen-Aliağa Highway (Figure 5). Some critical soil parameters needed to be addressed when the soil profile of the research area was examined. The possible mechanisms of the deformations are the liquefaction and settlement problems of loose granular units in the soil profile of the project area with high seismicity and the potential for consolidation settlement of clay units. A separation of approximately 15-20cm was observed between the bridge deck and the support bench due to the consolidation settlements above permissible limits and possible liquefaction (Figure 5).
Figure 5:Deformation observed as 15-20cm separation between the bridge deck and the support bench.

Simplified Method’ in liquefaction assessment
Problems due to liquefaction usually occur in the form of flow collapse, loss of bearing capacity, sand boiling, retaining structure failure that exposes buried structures, and lateral displacement [10-12]. The methods used to find the safety factor against liquefaction are examined under three main categories: empirical methods, analytical and material modeling. Empirical methods have become a widely used method in the determination of liquefaction potential in soil engineering practices due to the difficulties in using analytical and material modeling methods. The most well-known method in the empirical methods was proposed by Seed [10] and a later “Simplified Method” approach was developed and updated by Youd et al. [13]. The liquefaction potential of the study area was calculated using the “Simplified Method” in this study. The safety coefficient against liquefaction in the study area selected in the study was calculated in light of the previous drilling studies, the geotechnical report, and the data obtained from field and laboratory tests [14].
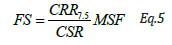
The “Simplified Method” approach is based on the ratio of the essential cyclic resistance ratio (CRR) of the soil to the cyclic stress ratio (CSR) caused by the seismic motion and the safety factor (FS) of the soil. The CSR is calculated based on the gravitational acceleration, the maximum horizontal ground acceleration, the effective stress, the total stress, and the co-efficiency of stress relief. These parameters are depth dependent parameters. On the other hand, CRR can be found with the help of SPT as determined by the sampling method, top layer load, rod length, energy ratio and well diameter correction parameters. Other parameter affecting the cyclic resistance ratio (CRR) is the fine grain ratio of the soil. By calculating the earthquake correction factor, the ratio of the cyclic resistance ratio to the cyclic stress ratio creates the safety factor against liquefaction. If the safety factor against liquefaction is FS≤1, it is known that the soil has a risk of liquefaction, while if the safety factor against liquefaction is FS>1, it is concluded that there is no risk of soil liquefaction.
The cyclic stress ratio (CSR) generated by seismic motion is calculated using Eq. 1 shown by Seed [10] as follows:

Where: amax: peak horizontal ground acceleration; g: gravitational acceleration (9.81m/s2); σv: total vertical stress; σ’v: effective stress; rd: stress reduction coefficient. Stress reduction coefficient, Seed et al. [10], with the help of Eq. 2a for (z ≤ 9.15 m) and Eq.2b for (9.15m ≤ z ≤ 23m):

The cyclic resistance ratio (CRR), which indicates the soil’s strength to liquefaction, is a function of the number of impacts measured by the Standard Penetration Test (SPT). The measure SPT blow count is normalized for the overburden stress at the desired depth and corrected to a standardized value (N1)60.
Then the CRR for the soil based on the computed clean-sand equivalent (N1)60 is found using the empirical curve drawn from the liquefaction of a magnitude 7.5 earthquake [15]. The following equation is provided for a good approximation when (N1)60 ≤30 because clean sands with a value of (N1)60 ≥ 30 (fine grain ratio close to zero) are considered very compact and are considered to be in the class of non-liquefaction soils:
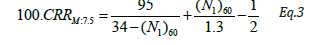
Where: CRRM:7.5 is the CRR for a Mw=7.5 earthquake
The lateral loading has been applied to the height of 3750mm using the cyclic displacement-controlled method, as shown in Figure 5. The maximum displacement corresponds to a drift of 4.2%. It is important to note that only CSW-1 is subjected to lateral load, whereas CSW-2, CSW-3, and CSW-4 are subjected to 450, 900, and 1350kN compression axial load, respectively, in addition to lateral loads. It should also be noted that before applying lateral load to the walls, axial loading has been applied to the walls and continued throughout the cyclic loading process.
The CRR values used in the equations given in Eq.3 are used for earthquakes with a moment magnitude of 7.5. Youd et al. [13] suggested an evaluation equation given in Eq. 4 according to the magnitude scaling correction (MSF) for earthquakes with moment magnitudes other than 7.5:
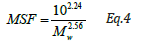
Where Mw is the moment magnitude of the earthquake. As a result, if the cyclic resistance ratio (CRR) of the soil is less than the cyclic stress ratio (CSR), there is a potential for liquefaction [3]:
Seismicity and liquefaction potential of the study area
Figure 6:Turkey’s Seismic Hazard Map including active fault lines and the study field [18].

Regarding the dynamic ground movements caused by an MW=7.0 earthquake causing liquefaction in the study area, the maximum horizontal ground acceleration was taken as 0.44g from the Turkey Earthquake Hazard Map, the study area taking into account (Figure 6). The ground acceleration coefficient was determined by considering the earthquake ground motion level and the soil class of the study area. The liquefaction potential of the study field was determined by the “Simplified Method” approach proposed by Seed [3] and later by Youd et al. [13]. The results of the analysis are given in Figure 7.
Figure 7:Liquefaction potential assessment.

It has been observed using the analyses made with the drillings in the selected area, that the layers of different depths and thicknesses have different levels of liquefaction potential at almost all four drilling locations in the bridge foundation study area (Figure 7). While the layer thicknesses that have the risk of liquefaction are limited to 4m in some locations, it has been observed that layers up to 20m thick in some areas around the foundations are at risk of liquefaction.
In addition to the danger of liquefaction that may occur in a region, the estimation of the severity of this liquefaction is also important. Iwasaki evaluated the degree of liquefaction (DL) in 1982 [16] as follows:
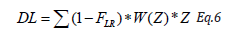
Where FLR is liquefaction resistance, and it equals:

W(Z) is the weight function of the soil layer and equals W(Z)=10- 2/3*Z. Z is the depth in m. Table 2 shows the relationship between liquefaction degree DL and liquefaction severity level [11,16,17]. Since the DL value was found to be 28 in the calculations, the liquefaction damage level of the study area was determined as ‘Very high’.
Table 2:Liquefaction severity [17].

Results and Discussion
According to the drilling data, it has been determined that the study area consists of alluvial units. In addition, since the groundwater level varies between 3.10-4.05m in the drillings made in the study area, possible causes of deformations are considered as the potential for liquefaction of loose granular units in the soil profile and consolidation settlement of clay units. Soil parameters obtained as a result of laboratory and field tests carried out with the specimens obtained with a total of 160m of drilling from the Ulukent Seyrek highway bridge study area was evaluated using the Simplified Liquefaction Analysis Method (SLAM) [5]. The results of the analyses performed are summarized in the relative tables. Based on the “Turkey Earthquake Hazard Map” determined by the decision of the Council of Ministers of Turkey, the effective ground acceleration of the study area was determined as Ao=SDS x0.4=0.44 according to the calculations made in the “AFAD (Ministry of interior disaster and emergency management presidency) Turkey Earthquake Hazard Maps Interactive Web Application”. Local soil class is ZE, which means ‘the study area is defined as layers of loose sand, gravel, soft-solid clay, or profilers with a total thickness of more than 3 meters (cu<25kPa) of soft clay layers satisfying the conditions PI>20 and w>40%” [18]. After the liquefaction potential analysis, vertical and lateral displacement analyses due to liquefaction were performed using the Ishiara and Yoshimine evaluation method [2]. In these analyses, the total amount of lateral displacement (ΔLDI) was found to be 2.46m and the total dynamic settlement (DS) was found to be 0.26m. According to the settlement analyses, the time required for the total settlement to decrease to the allowable levels has been calculated as approximately 49.33 years and since the filling has been present for more than 7.5 years, the remaining settlement is above the allowable specification criteria. Moreover, it was concluded that the clay units in the study area caused consolidation settlement under fill loads. Terzaghi [19,20], PI–Φ› correlation determine the effective internal friction angle in the long-term analysis of clay units. As a result of the calculations, it is evaluated that the proposed soil improvement method in the Seyrek highway intersection bridge approach fillings examined in this study should meet the stability, settlement and liquefaction criteria. In such bridge approach embankment soil where both liquefaction and settlement problems are high, it would be appropriate to use DSM (deep soil mixing) columns together with methods to create drainage channels.
Conclusion
The results obtained specified the depths of the drillings for which the analyses were made, the soil classes at these depths, and the liquefaction potentials for each layer. The liquefaction potential of the project area was found between 3.80-10.5 m in depth using laboratory and field tests done with the SK-1, SK-2, SK-3, and SK-4 borehole specimens. Moreover, according to the SLAM results, despite the soil type being SC and having low SPT-N values, no liquefaction potential was found after 10.5. Therefore, the importance of the effects of grain properties such as the percentage of plastic fines, average grain diameter and plasticity index in liquefaction analyses based on the SPT-N number was also shown in this study. Moreover, the maximum settlement amount in the infilled soil is calculated as the consolidation settlement under the expected soil conditions of the time-dependent settlement problem. It was concluded that the clay units in the study area caused consolidation settlement under the fill load. As a result, soil improvement and reinforcement methods such as DSM columns and drainage canals were advised to be used in Seyrek highway bridge embankments in the study field to ensure the safety of the engineering projects against the damage caused by liquefaction and settlement in the study area.
Acknowledgment
The author would like to thank the Izmir 2nd Regional Directorate of Turkish Highways R&D for their valuable contribution to the realization of this study.
References
- Ishıhara K (1996) Soil Behaviour in Earthquake Geotechnics. In: (1st edn), Claredon Press, Oxford.
- Ishihara K, Yoshmine M (1992) Evaluation of settlements in sand deposits following liquefaction during earthquakes. Soils and Foundations 32(1): 173-188.
- Seed H, Idriss Izzat M (1971) Simplified procedure for evaluating soil liquefaction potential. J Soil Mech Found Div 97(9): 1249-1273.
- Thapa DR (2018) Seismicity of Nepal and the surrounding region. Bull Dept Geol 20-21: 83-86.
- Yasuda S (2004) Evaluation of liquefaction-induced deformations of structures. In: Ansal A (Ed.), Recent Advances in Earthquake Geotechnical Engineering and Microzonation, Kluwer Academic Publishers, Netherlands, pp. 199-230.
- Chu J (2013) Innovation in disaster mitigation technologies. In: Geotechnical predictions and practice in dealing with geohazards. Springer, Netherlands, pp. 375-384.
- Hamada M (2014) Soil liquefaction and countermeasures. Engineering for earthquake disaster mitigation. Springer, Japan, pp 125-152.
- Huang W, Yen Z (2014) Recent developments of soil improvement methods for seismic liquefaction mitigation. Natural Hazards, 76: 1927-1938.
- Timur E, Sari C (2020) Determination of liquefaction resistance and allowable bearing capacity of soils based on VS (Shear wave) velocity; Case Study: Isparta suleyman demirel industrial region waste treatment facility. International Journal of Computational and Experimental Science and Engineering (IJCESEN) 6(3): 180-188.
- Seed HB, Idriss IM, Arango I (1983) Evaluation of liquefaction potential using field performance data. J Geotech Eng 109(3): 458-482.
- Sonmez H, Gokceoglu C (2005) A liquefaction severity index suggested for engineering practice. Environ Geol 48: 81-91.
- Kongar I, Rossetto T, Giovinazzi S (2016) Evaluating simplified methods for liquefaction assessment for loss estimation. Nat Hazards Earth Syst Sci 17: 781-800.
- Youd TL, Idriss IM (2001) Liquefaction resistance of soils: Summary report from the 1996 NCEER and 1998 NCEER/NSF workshops on evaluation of liquefaction resistance of soils. J Geotech Geoenviron Eng 127(10): 817-833.
- Robertson PK, Fear CE (1995) Liquefaction of sands and its evaluation. Earthquake Geotech Eng.
- Bhochhibhoya KCS, Adhikari P, Adhikari P, Gautam D (2020) Probabilistic seismic liquefaction hazard assessment of Kathmandu valley, Nepal. Geomat Nat Hazards Risk 11(1): 259-271.
- Wang JGZQ, Law KT (1994) Siting in Earthquake Zones. AA Balkema/Rotterdam/Brookfield, pp. 70-89.
- Iwasaki T, Tokida KI, Tatsuoka F, Watanabe S, Yasuda S, et al. (1982) Microzonation for soil liquefaction potential using simplified methods. In: Proceedings of the 3rd International Conference pn Microzonation, Seattle 3(2): 1310-1330.
- Idriss IM, Boulanger RW (2008) Soil liquefaction during earthquakes. Earthquake Engineering Research Institute, 2nd edition, ISBN-10: 193288436X.
- AFAD (2023) Ministry of interior disaster and emergency management presidency.
- Terzaghi K, Peck RB, Mesri G (1996) Soil mechanics in engineering practice. 3rd Edition, John Wiley and Sons, Inc., New York, USA.
© 2023 Nazife Erarslan. This is an open access article distributed under the terms of the Creative Commons Attribution License , which permits unrestricted use, distribution, and build upon your work non-commercially.
Editor In Chief


.jpg)


Signup for Newsletter

Quick Links
 Editorial Board Registrations
 Submit your Article
 Refer a Friend
 Advertise With Us
Our Recent Edition

.jpg)


Top Editors


.jpg)


.bmp)
.jpg)
.png)
.jpg)


.png)

.png)


.png)


Financial Support

Sponsors

Latest e-Books

Latest Video

 a Creative Commons Attribution 4.0 International License. Based on a work at www.crimsonpublishers.com.
Best viewed in
a Creative Commons Attribution 4.0 International License. Based on a work at www.crimsonpublishers.com.
Best viewed in