
- About Us
- Guidelines
-

The Author ensures that the research has been conducted responsibly and ethically with adherence to all relevant regulations. read more..
- For Authors
- For Reviewer
- Manuscript Guidelines
- Membership
-
- Journals
- Reprints
- e-Books
- Videos
- Indexing
- Contact Us
 COVID-19
- Submissions


Full Text
Novel Research in Sciences
Structural Analysis and Thermal Characterization of Composites from HPC And Fe2O3 Nanoparticles
Najlaa D Alharbi1,2* and Nabawia A El Zaher3
1Physics Department, Faculty of science, King Abdulaziz University, Jeddah, Saudi Arabia
2University of Jeddah, College of Science, Department of Physics, Jeddah, Saudi Arabia
3Textile Metrology Lab, National Institute for Standards, Giza, Egypt
*Corresponding author:Najlaa D Alharbi, Physics Department, Faculty of science, King Abdulaziz University, Jeddah, Saudi Arabia
Submission: May 10, 2021;Published: May 12, 2021
.jpg)
Volume7 Issue5May, 2021
Abstract
In this study, hydroxypropyl cellulose and iron (III) oxide nanoparticles (HPC: Fe2O3NPs)composites were prepared for use in various technological applications. Using X-ray Diffraction Technique (XRD), the Differential Scanning Calorimetry (DSC) and Thermal Gravimetric Analysis (TG), structural composition and thermal properties of the prepared nanostructures were examined. Fourier transform infrared TCI, LOI and HBI indices were also calculated. The observed XRD patterns indicate changes in the crystallinity: amorphosity ratio and indicate a mixture between the amorphous components of the HPC polymer and the Fe2O3nanoparticles which distinguishes the relationship between the properties of the structure. Variations have been detected in the glass transition (Tg) and melting (Tm) temperatures, the shape and area of recorded peaks that may be due to different degrees of crystal and the interactions exist between HPC and Fe2O3 nanoparticles. The obtained results noticed that Fe2O3 nanoparticles mix with HPC can improve the performance properties of HPC and can lead to interest technological applications.
Keywords: Hydroxypropyl cellulose; Iron (III) oxide nanoparticles; Nanocomposites; XRD technique; Thermal properties
Abbreviations: DSC: Differential Scanning Calorimetry; TG: Thermal Gravimetric; XRD: X-ray Diffraction Technique; HPC: Hydroxypropyl Cellulose; CrI: Crystallinity Index; DTG: Differential Thermo Gravimetry
Introduction
Good biocompatibility and degradable polymeric materials has great attention [1]. Polymeric nanoparticles materials such as inorganic carbon blacks, nanomaterials, semiconductors, magnetic materials, and minerals have attracted many researchers due to their physical and chemical properties and the effects of polymer matrix stability on nanoparticles [2-5]. In addition, due to their important technological role, these nanocomposites have been used in a large number of advanced applications in the medical and industrial fields such as medical, packaging, geotextiles, building, electronics, and automobiles [6-8]. Hydroxypropyl Cellulose (HPC) is a derivative of cellulose. HPC is a semi-synthetic polymer material belonging to the non-ionic cellulose ethers. It is non-ionic water soluble. HPC is chemically modified from natural cellulose and offers excellent biocompatibility, biodegradability, barrier properties, aesthetic and non-toxic appearance [1]. HPC is widely regarded as an environmentally friendly and multifunctional polymer, which has been used in the packaging of nutritional, cosmetics, and biomedical fields [9-12]. HPC can be used as thickening agent, tablet binding, modified release and polymer coating [13]. HPC has been investigated for use in mucous membrane delivery systems for many different drugs [14,15]. HPC was also used as a sieving matrix to separate DNA by electrophoresis and microchip [16]. Nanotechnology has attracted great interest in many areas for investigations to develop nanoscale materials (diameters ranging 1-100nm). Iron oxide has attracted increasing attention for different applications [17]. Iron oxide is a mineral compound that occurs in abundance in nature. Iron oxide has more than crystalline structure and different structural and magnetic properties [18]. Iron oxide is a mineral compound that shows polymorphs, including hematite (α-Fe2O3), maghemite (γ-Fe2O3) and other oxides in the forms beta (β-Fe2O3) and epsilon (ε-Fe2O3) [18]. Hematite is one of the main forms of iron oxides; it is existing as a mineral in nature and occurs widely in rocks and soils [18]. It behaves paramagnetic behavior and has a hexagonal structure. α-Fe2O3 is easier to synthesize and is the end product of other forms of iron oxide transformation. Hematite (α-Fe2O3) is one promising candidate for photo-catalytic applications, photo-electrode material and semiconductor materials [19].
Since HPC belongs to polymers formed on the bases of the main chain of polysaccharide, the analysis of transitional temperatures under the influence of nanoparticles permits to obtain information related to the interaction of the organic and inorganic constituents [20]. A study of HPC hybrid nanocomposites with silica was also reported [21]. Cellulose combined with magnetic particles was used as a material for magnetic paper and other magnetically responsive cellulose composites [22]. For different applications such as recyclable catalysts; magneto-optical applications; antibacterial or contrasting materials; magnetically retrievable oil adsorbents; magnetic aerogels; and cellulose composite films, magnetic cellulose-based nanomaterials were used [22]. In addition, the thermal performance of the final composite materials is necessary to ensure the suitability of the nanocomposite product for different applications [23]. The most common techniques used for thermal characterization of nanocomposites are the Differential Scanning Calorimetry (DSC) and the Thermogravimetric Analysis (TG) [24,25]. In the current work, different ratios (20:0, 20:0.5, 20:1, 20:1.5, 20:2 and 0:20 mass: mass) of HPC:Fe2O3NPs composites were prepared. Using X-Ray Diffraction Technique (XRD), a Differential Scanning Calorimetry (DSC) measurement and Thermal Gravimetric analysis (TG), structural composition and thermal properties of the prepared nanocomposites for use in different technological applications have been studied. In addition, the Fourier transform infrared TCI, LOI and HBI indices were also calculated.
Experimental
Materials and nanocomposites preparation
The Hydroxypropyl Cellulose (HPC) powder with an average molecular weight of 100,000 and 20 mesh particle sizes was purchased from Alfa Aesar, GmbH & Co., UK. Iron (III) oxide (α-Fe2O3) – hematite and red nanopowder (<100nm particle size), trace metals basis 99.9% with molecular weight 159.688 and melting point 1538 °C was provided by Strem Chemicals, UK, Ltd. All chemicals were of analytical grade. To prepare HPC:Fe2O3 NPs composites; HPC powder was mixed with different proportions of red α-Fe2O3 NPs powder (0.5, 1.0, 1.5 and 2.0 mass%). Raw materials were grounded with a small mill (Phillips PW 4018/00 Mini-Mill) for 15 minutes at a rotational speed of 3400rpm to form homogenous compounds [26].
Measurements
X-ray diffraction (XRD)
The crystalline structures of the prepared nanocomposites were characterized by using X-Ray Diffractometer PW-1480 (Netherland) equipped with nickel-filtered CuKα radiation at the wavelength 0.15406nm. The operating conditions were 35kV voltage and 20mA current with Match 3+PDF4 2015program analysis model. The XRD pattern was recorded in the range of 2θ from 5 to 70° at a speed rate of 2 degrees per minute.
Thermal analysis
The DSC-50 and TGA-50H instruments (Schimadzu-Kyoto, Japan) were used to perform a Differential Scanning Calorimetry (DSC) measurement and a thermogravimetric analyzer, respectively. The measurements were performed under nitrogen atmosphere in the temperature range from 20 to 750 °C at the heating rate of 10 °C min-1 and at the flow rate of 20mL min-1.The dry sample (ca. 6.22mg in average) was loaded in an aluminum pan.
Results and Discussion
X-Ray Diffraction (XRD) analysis
XRD has been studied to verify the crystal formations of HPC:Fe2O3NPs composites. The XRD patterns of the nanocomposites in the scanning range from 2θ=5° to 70° were shown in Figure 1. The XRD diffractogram of the HPC (20:0 mass/mass) confirmed the coexistence of both amorphous and crystalline regions in the HPC polymer [27,28]. The pattern showed diffraction peaks at 2θ=14.93°, 16.55°, 22.56° and 34.50° indexed as (1ī0), (110), (200), and (040) planes, respectively [29,30]. From the XRD patterns of HPC:Fe2O3NPs composites 8 peaks started to appear, and their intensities increase with increasing the content of Fe2O3 NPs. From the pattern the nanocomposite 20:0.5 mass: mass, four characteristic peaks indicating mainly hematite were started to appear at 2θ=33.13°, 35.62°, 49.44° and 54.05°. As the content of Fe2O3 nanoparticles increased up to 10 mass% (nanocomposite 20:2 mass/mass), the peaks began to grow and four other peaks were also appeared at 2θ=24.05°, 40.81°, 62.35° and 63.92° (20:2 mass: mass nanocomposite). These detected peaks indicate that the presence of Fe2O3NPs with different concentrations can cause structural variation in the HPC network and confirm the presence of Fe2O3NPs crystals within the polymeric matrix [31]. Additionally, these peaks coincided with those in the XRD pattern of the synthetic Fe2O3 nanopowder which is pure α-Fe2O3 phase (Figure 1). From the pattern nine crystalline strong diffraction peaks were detected at 2θ=24.24°, 33.26°, 35.74°, 40.94°, 49.52°, 54.05°, 57.57°, 62.43° and 64.07° indexed as (012), (104), (110), (113), (024), (116), (018), (214) and (300) planes, respectively. These identified peaks of XRD pattern belong to the characteristic peaks of α-Fe2O3 rhombohedral crystalline structures (JCPDS no.: 24-0072) [32,33]. The Crystallinity Index (CrI) is a parameter used to measure the relative crystallinity empirically and have been calculated using the following empirical relationship [30,34]:
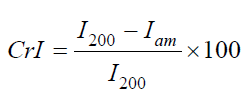
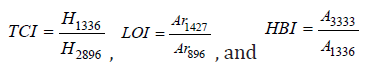
Where I200 is the diffractogram height of (200) plane as a fundamental peak and Iam is the height of the amorphous peak. From the obtained patterns in Figure 1, two distinguished peaks were centered at 2θ=22.55°-22.69° as fundamental peak and at 2θ=15.05°-16.55° as a secondary peak. Table 1 represents the variation of (CrI) of HPC:Fe2O3NPs composites. From the table it was observed that CrI values gradually decreased as the Fe2O3NPscontentincreased. The decrease in CrI means that amorphous region dominated. The results indicate structural changes in the polymer matrix where the Fe2O3 nanoparticles were present [35]. The decrease in the crystallinity index in the nanocomposites may be attributed to the differences in internal mechanisms that occurred due to the induced effect of Fe2O3 nanoparticles on the HPC structure. As a result, differences were produced in the configuration of the HPC network structure. Fourier Transform Infrared (FTIR) transmittance spectra for HPC:Fe2O3 NPs composites were previously studied [2] at room temperature by using potassium bromide pellet technology [36] and a Bruker Vector 22 Spectrophotometer (Germany) with a resolution of 4 cm−1 and accuracy better than ±1% to record the FTIR spectra. Figure 2 shows the FTIR spectra of HPC, Fe2O3NPs and their composites (HPC:Fe2O3NPs) in the wavenumber range 4000-400cm-1 and the chemical designations have been considered as previously reported [2]. The main functional groups of the nanocomposites from the ATR FT-IR spectra in the wavenumber range 4000-400cm−1 were also identified and previously examined [2]. The ratio of the crystalline to amorphous regions of cellulose was identified by the infrared TCI, LOI and HBI indices [37]. The infrared crystallinity ratio was determined from the Total Crystalline Index (TCI). TCI was proportional to the crystallinity degree of cellulose and presented by Nelson and O’Connor [38]. The Lateral Order Index (LOI) represents the overall order of arrangement in cellulose and was detected from the strip areas in 1427 and 896cm-1 which correspond to the amount of crystalline composition and the amorphous region in cellulose, respectively [38]. The Hydrogen Bond Intensity (HBI) of cellulose was related to the crystalline system and the degree of uniformity of the molecules considered by the chain movement and the bonding distance, i.e., crystallinity [39]. The subsequent indices: TCI,LOI and HBI of the nanocomposites were identified using relationships [40]:
Table 1: Crystallinity Index (CrI) and their percentage changes of HPC:Fe2O3NPs composites.

Figure 1:XRD patterns of HPC:Fe2O3NPs composites.

Figure 2:FTIR spectra of HPC:Fe2O3NPs composites as previously represented [2].

 (2)
(2)
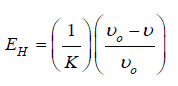
Where: H1336 and H2896 are the band heights at 1336 and 2896cm-1, respectively (corresponding to the O-H bending vibration mode and the C-H stretching vibration band, respectively); Ar1427 and Ar896 are the areas of the bands at 1427 and 896cm-1, respectively (corresponding for O-H, C-H bending, -CH2 deformation and C-O deformation and -CH2 rocking, respectively); and A3333 and A1336 are the absorbance at 3333 and 1336cm-1, respectively (corresponding to the hydrogen bonding OH stretching and OH bending vibration modes, respectively). Also, the energy of the hydrogen bond (EH) of the OH stretch group was calculated using the relationship [41]:
 (3)
(3)
Where 1/K (=2.625x10²) kJ is a constant, νo is the standard frequency corresponding to the free OH group at 3650cm-1 and ν is the frequency of the bonded OH group. From the obtained ATR FTIR spectra (Figure 2), the TCI, LOI, HBI and the hydrogen bond energy (EH) indices were detected and tabulated in Table 2. From the table, nanocomposite 20:0.5 mass: mass had higher TCI and LOI values indicating a higher degree of crystallinity and more cellulose structure than other nanocomposites. The lower cellulose infrared crystallinity values for 20:2.0 mass: mass nano composite indicates that the composite is made up of a greater number of amorphous domains. It was also noted that, a slight variation in the energy of hydrogen bonds (EH) of the O-H stretching band was observed. The hydrogen bond energy is higher in 20:0.5 mass: mass nano composite than other samples that may be due to its higher crystallization. This is consistent with was discovered in XRD patterns and leads to more hydrogen bonds and then higher hydrogen bond energy. Also, it was observed from the table that 20:0.5 mass: mass nano composite showed higher HBI value than other composites. The obtained results indicate that the 20:0.5 mass: mass nano composite contains more cellulose chains in a very organized way. This results a higher density of the hydrogen bond between adjacent cellulose chains and leads to a crystalline cellulose structure more filling than other nanocomposites. The detected changes in the TCI, LOI and HBI indices, and also the hydrogen bond energy (EH) of HPC:Fe2O3NPs composite scan be attributed to the presence of α-Fe2O3 NPs on the HPC network and the formation of hydrogen bond between the α-Fe2O3NPs and HPC, which reduces the extent of hydrogen bonding between molecules in the HPC.
Table 2: Infrared crystallinity ratios and their percentage changes as well as the hydrogen bond energy for HPC: Fe2O3NPs composites at their peak positions.

Differential scanning calorimetry (DSC) analysis
Differential Scanning Calorimetry (DSC) was a commonly used technique for determining transmission temperatures such as glass transmission, melting temperature, cross-link reactions, purity and degradation rate and also to measure transmission temperature, specific heat, heat emission and certain isothermal functions [42-44]. The Differential Scanning Calorimetry (DSC)was examined in the range of temperature 20-600 °C to detect the thermal shifts of the prepared HPC:Fe2O3NPs composites and the curves were shown in Figure 3. Table 3 illustrates the difference in transition temperatures and heat associated with fusion. From the figure and the table, the curves for HPC:Fe2O3NPs composites show a broad peak in the range from 54 to 57 °C and represents the first order thermodynamic transition (Tth) and may also be due to glass transition with heat of fusion (ΔH) in the range from -14.18 to -20.74Jg-1 designated as a thermal effect due to evaporation of moisture from the composite indicates the miscibility of the systems [45]. The second endothermic stage represents the phase transition temperature (Tm) resulting from the relaxation of the chain segments in the amorphous portion of HPC. Two endothermic peaks were displayed at about 360 and 389 °C with heat of fusion (ΔH) -120.41 and -114.62Jg-1 belong to the decomposition temperatures of the pure HPC [31]. For HPC:Fe2O3NPs composites the decomposition peaks were shifted toward higher temperature values with increased concentration of Fe2O3NPs.A difference in the shape and area of the decomposition peaks was observed which can be attributed to a different degree of crystallinity or in the arrangement of the molecules presented in the investigated nanocomposites. In addition, a decrease in heat of fusion (ΔH) and an increase in the melting temperature values were detected. This notice that reduces in the crystalline structure by increasing the degree of cross-linking can results from HPC and Fe2O3NPs interactions in the amorphous phase of HPC. Also, disorder in the crystals was created which caused a decrease in the enthalpy of the phase change [46,47]. The change obtained can be attributed to the variance in the internal mechanisms that occurred as a result of the induced effect of different contents of Fe2O3 nanoparticles on the configuration of the HPC structure. This prediction corresponds to the crystallinity index and the values of infrared crystallinity indices values determined from the XRD patterns and FTIR spectra (Tables 1 & 2).
Figure 3: DSC curves of HPC:Fe2O3NPs composites.

Table 3: Transition temperatures and associated heat of fusion forHPC:Fe2O3NPs composites.

Thermogravimetric (TG and DTG) analysis
Thermal Gravimetric Analysis (TG) was used to understand the pyrolysis and stability of polymers [48]. TG was enabled to determine the value of moisture loss from polymers and also indicates that thermal stability depends on the polymer microstructure. The TG and DTG curves of HPC, Fe2O3 nanopowder and HPC:Fe2O3NPs composites cover the range from 20 to 750 °C were shown in Figure 4. Three different mass losses were observed: 1) the first mass loss was detected in the temperature range 20-150 °C; 2) the second mass loss occurs in the temperature range 250-400 °C; and 3) the third mass loss occurs in the temperature range 400-750 °C. The three mass loss steps indicate that there is more than one degradation process. The second and third steps in TG curves cover a broad temperature range from 250-750 °C including melting points, such as physical transition and degradation temperatures. The % mass losses and the midpoint temperatures at first order thermodynamic transition and melting temperature regions were listed in Table 4. From the TG curves, it was noticed that the first loss step was illustrated by endothermic peaks in the range between 47 and 52 °C and ended at around 70 and 93 °C with small values of % mass loss occurs as a result of the evaporation of the water physically adsorbed on the substances. The second loss step, starting above 250 °C corresponds to the mass loss resulting from the decomposition of the compound’s structure. This second step can be attributed to melting and degradation of the morphological components that make up the structure configurations of HPC and characterized by the melting endothermic peak presented at about 315 °C. Also, the values of the second step midpoint melting temperatures were lower for HPC with Fe2O3NPs than that for pure HPC. Cao and Bhoyro [49] reported that the polymer melting temperature decreases with increasing moisture content. The endothermic third decomposition values of 20:0.5, 20:1.0 and 20:1.5 HPC: Fe2O3NPs (mass: mass) composites were detected at about 511, 482, 501, and 427 °C, respectively. These values were lower than that of the pure HPC observed one (about 440 °C). This may be because the higher the content of Fe2O3 NPs in the HPC network, the more thermally stables the composite were disposed. This data indicates that Fe2O3NPs are better separated in the HPC matrix. Whereas for the composite 20:2.0 mass: mass, the degradation mid-point temperature was around 427 °C indicating a 3% decrease in the value of that in pure HPC.
Figure 4: TG and DTG curves of HPC:Fe2O3NPs composites.

Table 4: TG data for HPC:Fe2O3NPs composites.

Table 5 listed the total % mass loss at the end of the thermal decomposition of the prepared nanocomposites. It was illustrated that the total % mass loss decreases (about 9%) by increasing the presence of Fe2O3NPs in the composite up to 10 mass%. This means that the composite 20:2.0 mass: mass has the highest residue % value (about 16%) at the end of the thermal decomposition which indicates that the thermal stability of this nanocomposite has been strengthened and becomes more resistant to fire hazards. The second and third decompositions were most important in the total mass loss and also, rate of mass loss. Moreover, the prepared nanocomposites became more thermally stable with increasing the content of Fe2O3 nanoparticles which notice better dispersed of Fe2O3NPs in HPC network. The thermal stability of the composites could be obtained from the initial temperatures of the pyrolysis steps as previously mentioned by Chiu [50]. The Differential Thermo Gravimetry (DTG) curves of the prepared nanocomposites were also shown in Figure 4. Within the range 200-400 °C, DTG curves showed a peak (center at about 315 °C) that could be mostly caused by HPC pyrolysis. The degradation temperatures of the HPC:Fe2O3NPs composites were estimated from the maximum of the DTG peaks and listed in the figure. It was observed that, the detected decomposition values increase with the presence of Fe2O3NPs in the composite that reflects the degraded reaction of HPC. This means that the release of heat during degradation occurred at the end of the temperature curves. Also, the change in detected melting temperature values was associated with the infrared active groups [2] of HPC:Fe2O3NPs composites. This may be due to the fact that the nanocomposite contains more than one component due to the presence of α-Fe2O3NPs on HPC matrix and the formation of a hydrogen bond between the α-Fe2O3 NPs and HPC which reduces the extent of hydrogen bonding molecules of HPC.
Table 5: Total % mass loss and residue % data for HPC:Fe2O3NPs composites. *Residue %=100-Total % mass loss.

Conclusion
The data obtained for the XRD, FTIR indices and thermal analyses represent information related to the structural properties of HPC and Fe2O3NPs and their nanocomposites. Analysis of XRD patterns reveals a decrease in the crystallinity index with an increase in the concentration of Fe2O3NPsindicating that structural changes produced in the HPC matrix with the proliferation of Fe2O3NPs.The results of DSC show the difference in shape and area of the degradation endothermic peaks. By thermogravimetric analysis it shows that the composites decomposed around 315 to 323 °C. The total % mass loss detected remarkable decrease with increasing the content of Fe2O3 nanoparticles and it varies from 0.1 to 9.2%. These decreases illustrate that the prepared nanocomposites became more thermally stable, more resistant to fire hazards and also, better dispersed of Fe2O3NPs in HPC network. Also, the obtained data could be used to predict properties related directly to the thermal degradation parameters. These findings confirm and agree the X-ray diffraction and FT-IR crystalline indices data.
Acknowledgment
This project was funded by the Deanship of Scientific Research (DSR), King Abdulaziz University, Jeddah, under grant No. (D-1441- 401-363). The authors, therefore, gratefully acknowledge DSR technical and financial support.
References
- Wang Y, Shi L, Wu H, Li Q, Hu W, et al. (2019) Graphene oxide–IPDI–Ag/ZnO@hydroxypropyl cellulose nanocomposite films for biological wound-dressing applications. ACS Omega 4(13): 15373-15381.
- Alharbi ND, Guirguis OW (2019) Macrostructure and optical studies of hydroxypropyl cellulose in pure and nanocomposites forms. Results Phys 15: 102637.
- Elawam SA, Morsi WM, Abou Shady HM, Guirguis OW (2016) Optical properties study of PMMA/PbO(NPs) composites films. Materials Science: An Indian Journal 14: 471-483.
- Schmidt G, Malwitz MM (2003) Properties of polymer–nanoparticle composites. Curr Opin Colloid Interface Sci 8(1): 103-108.
- Choudhary B, Chawla S, Jayanthi K, Sood KN, Singh S (2010) The effect of Al and B on the luminescent property of porous silicon. Curr Appl Phys 10(3): 807-812.
- Matsuyama K, Mishima K (2009) Preparation of poly(methyl methacrylate)-TiO2 nanoparticle composites by pseudo-dispersion polymerization of methyl methacrylate in supercritical CO2. J Supercrit Fluid 49(2): 256-264.
- Lai JCK, Lai MB, Jandhyam S, Dukhande VV, Bhushan A, et al. (2008) Exposure to titanium dioxide and other metallic oxide nanoparticles induces cytotoxicity on human neural cells and fibroblasts. Int J Nanomed 3(4): 533-545.
- Singh A, Kulkarni UK, Khan Malek C (2011) Patterning of SiO2 nanoparticle-PMMA polymer composite microstructures based on soft lithographic techniques. Microelectron Eng 88(6): 939-944.
- Angelova T, Rangelova N, Uzunova V, Georgieva N, Andreeva T, et al. (2016) Cytotoxicity and antibiofilm activity of SiO2/cellulose derivative hybrid materials containing silver nanoparticles. Turk J Biol 40: 1278-1288.
- Ogiwara T, Katsumura A, Sugimura K, Teramoto Y, Nishio Y (2015) Calcium phosphate mineralization in cellulose derivative/poly (acrylic acid) composites having a chiral nematic mesomorphic structure. Biomacromolecules 16(12): 3959-3969.
- Chiba R, Nishio Y, Sato Y, Ohtaki M, Miyashita Y (2006) Preparation of cholesteric (hydroxypropyl) cellulose/polymer networks and ion-mediated control of their optical properties. Biomacromolecules 7(11): 3076-3082.
- El Fawal GF, Abu Serie MM, Hassan MA, Elnouby MS (2018) Hydroxyethyl cellulose hydrogel for wound dressing: Fabrication, characterization and in vitro Int J Biol Macromol 111: 649-659.
- Kadajji VG, Betageri GV (2011) Water soluble polymers for pharmaceutical applications. Polymers 3: 1972-2009.
- Senel S, Hincal AA (2001) Drug permeation enhancement via buccal route: possibilities and limitations. J Control Release 72(1-3): 133-144.
- Okamoto H, Nakamori T, Arakawa Y, Iida K, Danjo K (2002) Development of polymer film dosage forms of lidocaine for buccal administration. II. Comparison of preparation methods. J Pharm Sci 91(11): 2424-2432.
- Sanders JC, Breadmore MC, Kwok YC, Horsman KM, Landers JP (2003) Hydroxypropyl cellulose as an adsorptive coating sieving matrix for DNA separations: Artificial neural network optimization for microchip analysis. Anal Chem 75(4): 986-994.
- Campos EA, Stockler Pinto DVB, Sampaio de Oliveira JI, Costa Mattos E, Cássia Lazzarini Dutra R (2015) Synthesis, characterization and applications of iron oxide nanoparticles-A Short review. J Aerosp Technol Manag 7(3): 267-276.
- Machala L, Tucek J, Zboril R (2011)Polymorphous transformations of nanometric iron (III) oxide: A review. Chem Mater 23(14): 3255-3272.
- Valášková M, Tokarský J, Pavlovský J, Prostĕjovský T, Kočí K (2019) α-Fe2O3 nanoparticles/vermiculite clay material: structural, optical and photocatalytic properties. Materials 12(11): 1880.
- Halamus T, Wojciechowski P, Bobowska I (2008) Synthesis and characterization of (hydroxypropyl)cellulose/TiO2 nanocomposite films. Polym Adv Technol 19(7): 807-811.
- Evmenenko G, Yu CJ, Kevalramani S, Dutta P (2004) Structural reorganization in films of cellulose derivatives in the presence of colloidal particles. Polymer 45(18): 6269-6273.
- Galland S, Andersson RL, Salajkova M , Ström V, Olsson RT, et al (2013) Cellulose nanofibers decorated with magnetic nanoparticles – synthesis, structure and use in magnetized high toughness membranes for a prototype loudspeaker. J Mater Chem C 1: 7963-7972.
- Vikas Mittal (2012) Characterization techniques for polymer nanocomposites. Wiley-VCH Verlag & Co. KGaA, Boschstr. 12, 69469 Weinheim, Germany.
- Bertolino V, Cavallaro G, Lazzara G, Milioto S, Parisi F (2018) Halloysite nanotubes sandwiched between chitosan layers: Novel bio nano composites with multilayer structures. New J Chem 42: 8384-8390.
- Bertolino V, Cavallaro G, Milioto S, Parisi F, Lazzara G (2018) Thermal properties of multilayer nanocomposites based on halloysite nanotubes and biopolymers. J Compos Sci 2: 41.
- El Zaher NA, Mohamed S, Melegy MS, Guirguis OW (2014) Thermal and structural analyses of PMMA/TiO2 nanoparticles composites. Nat Sci 6: 859-870.
- Trivedi MK, Nayak G, Patil S, Tallapragada RM, Mishra R (2015) Influence of biofield treatment on physicochemical properties of hydroxyethyl cellulose and hydroxypropyl cellulose. Molecular Pharmaceutics & Organic Process Research 3: 2.
- Joshi G, Rana V, Naithani S, Varshney VK, Sharma A, et al. (2019) Chemical modification of waste paper: An optimization towards hydroxypropyl cellulose synthesis. Carbohyd Polym 223: 115082.
- Takahashi Y, Matsunaga H (1991) Crystal structure of native cellulose. Macromolecules 24(13): 3968-3969.
- Tang Z, Li W, Lin X, Xiao H, Miao Q, et al. (2017) TEMPO-oxidized cellulose with high degree of oxidation. Polymers 9(9): 421-430.
- El Zaher NA, Osiris WG (2005) Thermal and structural properties of poly(vinyl alcohol) doped with hydroxypropyl cellulose. J Appl Polym Sci 96: 1914-1923.
- Morsy R, Hosny M, Reicha F, Elnimr T (2016) Development and characterization of multifunctional electrospun ferric oxide-gelatin-glycerol nanofibrous mat for wound dressing applications. Fiber-Polym 17: 2014-2019.
- Park C, Jung J, Lee CW, Cho J (2016) Synthesis of mesoporous α-Fe2O3 nanoparticles by non-ionic soft template and their applications to heavy oil upgrading. Sci Rep 6: 39136.
- Segal L, Creely IJ, Martin AE, Conrad CM (1959) An empirical method for estimating the degree of crystallinity of native cellulose using the X-ray diffractometer. Text Res J 29: 786-794.
- Thamaphat K, Limsuwan P, Ngotawornchai B (2008) Phase characterization of TiO2 powder by XRD and TEM. Kasetsart Journal: Natural Science 42: 357-361.
- Sankar V, Suresh Kumar T, Panduranga Rao K (2004) Preparation, characterization and fabrication of intraocular lens from photo initiated polymerised poly(methyl methacrylate). Trends Biomaterials and Artificial Organs 17: 24-30.
- Poletto M, Pistor V, Zattera AJ (2014) Structural characteristics and thermal properties of native cellulose. INTECH Open Science/Open Mind pp. 45-68.
- Carrilo F, Colom X, Suñol JJ, Saurina J (2004) Structural FTIR analysis and thermal characterization of lyocell and viscose-type fibres. Eur Polym J 40(9): 2229-2234.
- Oh SY, Yoo DI, Shin Y, Kim HC, Kim HY, et al. (2005) Crystalline structure analysis of cellulose treated with sodium hydroxide and carbon dioxide by means of X-ray diffraction and FTIR spectroscopy. Carbohyd Res 340(15): 2376-2391.
- Olaru A, Malutan T, Ursescu CM, Geba M (2016) Structural changes in hemp fibers following temperature, humidity, and UV or gamma rays radiation exposure. Cell Chem Technol 50: 31-39.
- Popescu CM, Singurel G, Popescu MC, Vasile C, Argyropoulos DS, et al. (2009) Vibrational spectroscopy and X-ray diffraction methods to establish the differences between hardwood and softwood. Carbohyd Polym 77: 851-857.
- Abdel Zaher NA, Moselhey TH, Guirguis OW (2016) Effect of fast neutrons on the structural and thermal properties of poly(vinyl alcohol) and hydroxypropyl methyl cellulose blends. J Therm Anal Calorim 126: 1289-1299.
- Osiris WG, Moselhey MTH (2012) Thermal and structural studies of poly(vinyl alcohol) and hydroxypropyl cellulose blends. Nat Sci 4(1): 57-67.
- Zhang SH, Painter PC, Runt J (2002) Dynamics of polymer blends with intermolecular hydrogen bonding: Broad-band dielectric study of blends of poly(4-vinyl phenol) with poly(vinyl acetate) and EVA70. Macromolecules 35: 8478-8487.
- Samal SK, Fernandes EG, Chiellini FC, Chiellini E (2009) Thermal analysis of PVA/CNTs 2D membrane. J Therm Anal Calorim 97(3): 859-864.
- Abdelrazek EM, Elashmawi IS, El Khodary A, Yassin A (2010) Structural, optical, thermal and electrical studies on PVA/PVP blends filled with lithium bromide. Curr Appl Phys 10(2): 607-613.
- Pielichowski K, Njuguna J (2008) Thermal degradation of polymeric materials. Smithers Rapra Technlogy.
- Gałka P, Kowalonek J, Kaczmarek H (2014) Thermogravimetric analysis of thermal stability of poly(methyl methacrylate) films modified with photoinitiators. J Therm Anal Calorim 115: 1387-1394.
- Cao J, Bhoyro AY (2001) Structural characterization of wool by thermal mechanical analysis of yarns. Text Res J 71(1): 63-66.
- Chiu J (1966) Applications of thermogravimetry to the study of high polymers. Appl Polym Symp 2: 25-43.
© 2021 Najlaa D Alharbi. This is an open access article distributed under the terms of the Creative Commons Attribution License , which permits unrestricted use, distribution, and build upon your work non-commercially.
Editor In Chief


.jpg)


Signup for Newsletter

Quick Links
 Editorial Board Registrations
 Submit your Article
 Refer a Friend
 Advertise With Us
Our Recent Edition

.jpg)


Top Editors


.jpg)


.bmp)
.jpg)
.png)
.jpg)


.png)

.png)


.png)


Financial Support

Sponsors

Latest e-Books

Latest Video

 a Creative Commons Attribution 4.0 International License. Based on a work at www.crimsonpublishers.com.
Best viewed in
a Creative Commons Attribution 4.0 International License. Based on a work at www.crimsonpublishers.com.
Best viewed in