
- About Us
- Guidelines
-

The Author ensures that the research has been conducted responsibly and ethically with adherence to all relevant regulations. read more..
- For Authors
- For Reviewer
- Manuscript Guidelines
- Membership
-
- Journals
- Reprints
- e-Books
- Videos
- Indexing
- Contact Us
 COVID-19
- Submissions


Full Text
COJ Technical & Scientific Research
Methodology for Licensing Burnup Credit in Nuclear Criticality Safety Analysis: A Calculational Basis
Leotlela MJ1,2* and Manyaapelo OB3
1 School of Physics, South Africa
2 Regulations and Licensing, South Africa
3 AHTR Engineering department, South Africa
*Corresponding author: Leotlela MJ, School of Physics, Regulations and Licensing, South Africa
Submission: January 09, 2019; Published: April 23, 2019

Volume1 Issue5April, 2019
Abstract
There are many nuclear power stations (NPSs) that are currently operating but are rapidly approaching the point where they will be running out of storage space in the spent fuel pool (SFP). In order to prolong their operation and prevent them from being shut down by the nuclear regulator, many have opted to follow the neutron absorber inserts route while others have opted for spent fuel casks. The other option for recovering the storage space lost as a result of fresh fuel calculation methodology is to take credit for burnup. This technique presents another option for saving storage space in the SFP or ISFSF. While few countries have licensed the technique, the few countries that have taken the lead in this are the USA, Japan and France [1-5]. The reasons for not doing so have been found to vary from country to country and from one person to another. The most common reason, however, which is often cited by both the licensee and the nuclear regulator, is uncertainty about the licensing process or the calculations entailed in licensing BUC. The aim of this paper is therefore to provide a calculational basis for what is entailed in licensing nuclear criticality safety analysis when BUC is taken into account.
Keywords:Keywords: Burnup credit; Nuclear licensing; Spent fuel storage; Spent fuel cask
Abbrevations: NPSs: Nuclear Power Stations; SFP: Spent Fuel Pool
Introduction
The storage of spent nuclear fuel is rapidly becoming a problem for NPSs that were commissioned in the 1980s. This leaves the nuclear facility management with the dilemma of having to choose between pursuing the cask storage and the neutron absorber inserts options to ease the demand for storage space in the SFP. This is in order to prevent the nuclear regulator from taking the more radical but unpopular option of shutting down the reactor, which may have devastating economic consequences by compromising the energy supply. To prevent the situation from spiralling out of control, rendering the nuclear licenses of the NPSs invalid owing to the violation of licensing conditions, other countries, for example the USA, Japan, France and South Korea [1-5], have adopted BUC techniques which enable the NPSs to preserve the storage space in SFPs and in spent fuel casks. This technique has proved to be very effective, both financially and technically, in saving the spent fuel storage lost to fresh fuel analytical techniques and also in reducing the number of spent fuel casks required to accommodate spent fuel. If BUC is applied it has been proven that it will buy the NPSs time before they run out of storage space as well as saving on the cost of purchasing casks [6,7]. Furthermore, it also reduces the number of trips required to transport spent fuel between the NPS and the ISFSF. The challenge associated with the decrease in storage capacity is further exacerbated by the fact that the SFP has its own loading requirements that have to be complied with; these are determined by its BUC loading curve [1,4,8]. Depending on the nuclide sets used in BUC analyses, the SFP can either allow for sparsely packed FAs where a checker board pattern is applied or much more densely packed FAs, as indicated in Figure 1. The enrichment of the FA to be placed in a densely packed region, as indicated at the top right corner of Figure 1, must be determined by calculating the keff of the system. Therefore, as a result of the over-conservatism associated with a fresh fuel approach and its ineffectiveness in conserving storage space, there is a continuous decrease in the storage space available.
Figure 1:Storage pattern of FAs in the SFP showing densely packed and sparsely packed region..

Methodology
When the fuel is irradiated in a nuclear reactor the fuel depletion process results in the original amount of fuel, 235U and 238U in the case of UO2, decreasing as a result of undergoing various nuclear reactions, mainly fission (Figure 2) [1-3]. This decrease is as a result of transmutation and/or decay, which in turn results in a continuous build-up of other nuclides such as decay or fission products that have a high neutron capture or neutron absorption cross section. The neutron absorption or capture process often leads to a decrease in the number of neutrons required for the fission process, and subsequently results in a decrease in the keff. However, not all fission products will give rise to a reduction in keff, as some (fissile nuclides like 239Pu, 240Pu, 241Pu and 242Pu) will result in an increase in keff. The continuous build-up of fissile and fertile nuclides in the reactor core adds positive reactivity to the system which if not accounted for in a criticality safety analysis can result in a nuclear excursion. The analyses in this research project were based on an SFP of arbitrary dimensions loaded with 17X17FA, as indicated in Figure 3, and were further divided into two scenarios [4]: fresh fuel and BUC approaches, which are described in detail in their respective areas.
Figure 2:Burnup-dependent concentration of a selection of nuclides important to criticality..

Figure 3:KENOVI calculational model of the reference storage rack configuration loaded with 17X17 FA. Reflective boundary conditions are employed on all sides to simulate an infinite array of storage cells..

Fresh fuel
The fresh fuel analysis scenario assumes that fuel has not been irradiated, i.e. it is fresh from the supplier and is being irradiated for the first time. There are therefore no nuclides for which credit for burnup can be taken for. Because no nuclides are taken credit for, there is a certain degree of conservatism built into the calculations, which often results in an over-estimation of, for example, the distance between adjacent FAs or the shielding thickness needed to prevent criticality from increasing beyond the regulatory safety margin; hence, a better safety margin [7]. The cask under study is Castor X/28F (Figure 4), which is made up of two separate radiation sources; the inner source made up of 12FAs and the outer source made up of 16FAs, which are positioned at an angle with respect to each other. The material composition together with the physical properties of this cask are summarized in Table 1.
Figure 4:Cross-section of castor/x28f spent fuel cask..

1. The geometry and the material composition of the cask play a very important role in enabling the cask to fulfil its storage function, namely: radiation shielding [8,9], nuclear criticality safety, confinement/structural integrity and thermal safety [10].
2. A number of parameters were evaluated to determine how variation in each of these would affect the keff of the cask when fully loaded with pressurized water reactor (PWR) FAs with an enrichment of 3.5 wt%. One of these factors was the effect of the chemical composition of the media with which the cask is flooded. To that effect, three scenarios were run: the first case was the cask operating under normal operating conditions and, thus, as a dry cask it was modelled as being filled with dry air; the second and the third were based on the cask being filled with fresh water and seawater respectively. The seawater ingress scenario has gained even more prominence in recent years because of the Fukushima Daiichi accident. The chemical compositions of the water referred to is shown in Table 2.
Table 1:Material composition of Castor X/28F.

Table 2:Physical properties of water which are important for nuclear criticality safety analysis.

The neutron multiplication factor versus temperature: Seawater contains significantly more chemical elements than fresh water, some of which have a very high cross section for neutron absorption. Since the chemical composition of seawater is a function of its salinity, the calculations in this model were based on a salinity of 35 parts per thousand (ppt or 0/00), which is the average salinity of seawater [4]. Chemical elements with significantly high microscopic absorption (σa) and scattering (σs) cross sections found only in seawater and not in fresh water are chlorine (Cl) and bromine (Br). A high neutron absorption cross section will reduce the number of available neutrons that would otherwise increase fission rate to lower quantities and thus reduce keff. The International Atomic Energy Agency (IAEA) requirement for the analysis of containers of hazardous nuclear fuel materials like the Castor X/28 cask is that the analysis must include heat up to 800 °C (1073.15K) [3,8]. To assess compliance with this requirement and the effect of temperature increase on the keff, the temperature was increased to 900K. As the temperature increases, the graphs in Figure 5 show that there is a decrease in keff due to Doppler broadening of the cross section, especially that of 238U [11,12]. The graphs also show a number of changes in slopes as temperature increases, which may be due to a transition in the internal phase and a change in the grain size of the microstructures that are the early signs of material degradation. The other physical property that is important, particularly to criticality is the logarithmic energy decrement (ξ), which is a measure of the number of collisions required to slow a high-energy neutron to the thermal energy range. This can be calculated from [11,12].
Figure 5:Effect of various flooding media on the keff based on fuel that is 3.5 wt% enriched.

where, E0 and Eth refer to higher and thermal energies respectively. The number of collisions n required to thermalize a neutron from E0 to Eth to Eth is given by
Furthermore, ξ can be calculated as
where A is the atomic mass of the scattering material. It will be noted from this that (1H1, 12C6) always
have higher ξ (ξ =1 and 0.158 for 1H1 and 12C6respectively). This implies that if light elements are used, one will need a lower number of collisions to reach thermal energy. Thus, although seawater contains carbon, with ξ = 0.158, which should assist in slowing neutrons down to thermal range and thereby improve the chance of fission, it does not in fact do so because a good moderator must have a large logarithmic energy decrement (ξ), a large scattering cross section (σs) and a low absorption cross section (σa). It therefore fails because ξ is too low and the scattering cross section (σs) of 4.8b is quite small compared to 38 b for hydrogen (Table 2). Thus, based on the moderating ratio (MR) in Equation 4, carbon on its own will not be able to thermalize neutrons to the level where they can effect an increase in fission [13].
Comparison of the results in Figure 5 indicates that water ingress into the cask, regardless of whether it is fresh water or seawater, will result in an increase in keff relative to that of a dry cask. However, seawater will have the lowest increase in keff, because of the large amount of chemical impurities it has relative to fresh water. Reading the keff at 296K, it is noted that the keff of fresh water and seawater is 0.9678, and 0.9369 respectively, whereas that of a dry cask at the same temperature is 0.2934. This implies that the cask which normally operates within the regulatory limit will exceed that limit if there is fresh water ingress. Furthermore, the increase in keff resulting from fresh water ingress will be a {kfw=0.9678-0.2934=0.6744}, while ksw resulting from seawater will be 0.6435.
Therefore, because of the compounding effect of all these factors, the change in keff, (Δk) relative to a dry cask, and its corresponding percentage increase as a result of the cask being flooded with water, will be higher keff than if it were not flooded. As a result of its chemical composition, seawater will display a lower increase in the keff relative to fresh water. The results in Figure 5 reveal that the ingress of seawater will result in an average increase of 2.363% in keff, whereas fresh water will increase it by an average of 2.483%. The percentage increase in keff is calculated according to Eqn 5, which is defined as [14]
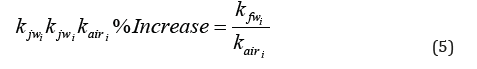
where fwi refers to fresh water at temperature i.
The same equation was used for seawater, where fwi was replaced with swi and swi refers to seawater at temperature i.
The effective neutron multiplication factor as a function of enrichment: When one is analyzing for compliance with regulatory requirements, which make it mandatory that no fissile system must have a 𝑘𝑒𝑓𝑓≤0.95 [10], it is observed from Figure 6 that a fresh water flooded cask will exceed the regulatory limit at 4.0wt%, while a seawater flooded cask will only exceed the regulatory limit at 4.68wt%. Comparison reactivity induced by freshwater and seawater on the basis of k at T=296K. In nuclear criticality safety analysis, it is accepted that if fuel has been in the reactor core for some time a number of nuclides will be generated (Figure 2) as a result of burnup and depletion of the fuel. When these nuclides are taken into account in this analysis, it will be observed that some of them will add a negative reactivity to the system, for example 241Am, 155Gd, 143Nd, 145Nd, 147 Sm, 150Sm, 151Sm, 152Sm, and many other principal fission products listed in Table 3, while others such as 239Pu, 240Pu 241Pu and 242Pu will add a positive reactivity [4].
Figure 6:Comparison of criticality induced by different compositions of water.

Table 3:Nuclide sets used in nuclear criticality safety analysis.

The phenomenon of taking credit for the reduction in criticality as a result of burnup is known as BUC [8,9]. When BUC is taken into account in criticality safety analysis, the system will result in lower keff than would have been the case had they not been taken into account, i.e. if they were treated as fresh fuel. This is confirmed by the results of the study summarised in Figure 7, which show that fresh fuel will exceed the regulatory limit at an enrichment of 4.39wt%, whereas the Actinides only nuclide set (at a burnup of 20 GWD/MTU) will only exceed the regulatory limit at 4.828wt%. On the other hand, the Actinides + Minor Fission Products and Actinides + Principal Fission Products in this analysis will be below the regulatory limit, irrespective of the burnup.
Figure 7:Comparison of effectiveness of the three BUC nuclides sets in decreasing the keff of the system based on keff as a function of enrichment.

Isotopic Correction Factors (ICFs)
When BUC calculations are performed, they have to take into consideration the fact that the isotopic composition of the fuel changes with burnup; this is often determined by experimental chemical assay and by calculations. It is, therefore, important to note that computational techniques used in predicting the isotopic compositions of various nuclides and for determining the ICFs have been verified and validated against a reputable reference. Standard, such as an experimental analysis [15]. Normally, calculations of isotopic compositions are validated against destructive chemical assay measurements from spent nuclear fuel (SNF) samples, while criticality analysis methods are validated against applicable critical experiments. The results of these two methods are then compared and, on this basis, the ICFs in Table 4 are derived [16,17]. The objective of using ICFs is to adjust the bias in the depletion and the uncertainty calculation [7]. According to the study summarized in NUREG/CR-6800 [7], it has been found that,
Table 4:Isotopic correction factors [17].

a. The application of the ICFs listed in Table 4 results in a very large penalty on the loading curve compared to calculations which do not take ICFs into account
b. Set 1 is more penalising that set 2.
Since Set 1 in Table 4 is more penalising, set 2 was used in this analysis [7]. As the FA is irradiated in the reactor core, it has been found that burnup along the axial height of the FA is higher in the middle section of the FA but lower in the top and lower parts, giving rise to an axial profile as shown in Table 4. The results of the study conducted by Oak Ridge National Laboratory indicate that in addition to changing along the length of the FA, the axial profile is also dependent on the burnup the FA is exposed to [17]. A number of studies have been conducted to determine the shape of the axial profile that corresponds to each burnup and the results are summarized in the following refs [7,16,18]. After several analyses, it was found that Table 4 was the most acceptable and was recommended for use in all BUC calculations where axial profile is taken into account. The ICFs are an important consideration in input data and must be added to the input file whenever BUC analysis is performed. Either of the sets listed in Table 4 may produce significantly different results in the keff of the system. It is therefore important that the analyst selects the appropriate column that corresponds with the burnup that is being used [15,17].
BUC analyses for castor X/28F
Although this analysis is based on Castor X/28, the technique is equally applicable to any transportation or storage cask. Although only actinide burnup credits are acceptable to some nuclear regulators, in this research an analysis of the loading curve based on all three sets of nuclides listed in Table 3 was used so as to compare their effectiveness/reactivity worth in as far as reducing the keff of a system and saving storage space are concerned. The nuclide sets in both cases, all air gaps in the cask were filled with water (seawater or fresh water, depending on the scenario) and the pressure was kept constant similar to normal operating conditions. It is observed that when the same cask is flooded with water with two different chemical compositions, i.e. fresh water and seawater and these are compared on the basis of the relationship between keff and enrichment at T=296K (Figure 6), again it is observed that the keff in both cases increases with an increase in fuel enrichment. However, as was observed earlier, the keff of the cask flooded with seawater is lower than that of the cask that is flooded with fresh water. This is to be expected since seawater contains a significantly higher concentration of salts in the form of chlorides (Cl) and bromides, which have a high neutron absorption microscopic cross section (σa). From neutron moderation theory, it is well known that neutrons are born in the high energy range (MeV). At such a high energy range, it is unlikely that they will induce fission when interacting with 235U fuel. It is, however, far more likely that fast neutrons will react with 238U or undergo inelastic scattering with lighter moderator nuclei (1H1 and 12C6) and slow down to the thermal energy range where they have a much higher probability of causing fission with 235U. During the slowing down process they may also leak out of the system or continue to diffuse until they are absorbed by either the fuel (235U in this case) or the moderator .The comparison of the effects of the two media was based on the changes in keff with an increase in moderator temperature as well as the increase in enrichment in either case.
Relationship between the moderator density and the neutron multiplication factor: With regard to establishing the relationship between the moderator density and the effective neutron multiplication factor, three simulations were run at three different temperatures: 296K, 600K and 900K. The enrichment on all of them was kept constant at 3.9wt% and only the density was changed. The results in Figure 8 show that as the water density increases, the keff will increase accordingly. In analyzing this, it is important to note that the Castor X/28 cask is a heterogeneous system in which the moderator is separate from the fuel. The sixfactor formula affects heterogeneous and homogeneous systems differently. In a heterogeneous system the flux in the fuel region will differ from that of the moderator region primarily because of the absorption rate of the fuel. This is further compounded by the fact that the volume of the fuel, the moderator and the poison will also differ in the two regions. Thus, the factors that play a key role in the value of the keff of the system when the density of the moderator changes are the resonance escape probability and thermal utilisation factor, which will be discussed in detail in section 6. This is because when the fuel temperature increases, the water moderator expands (resulting in a decrease in density), forcing a significant amount of water out of the cask. This will then result in an increase in the thermal utilization factor as the temperature increases because the neutrons have a much better chance of reacting with the fuel. As a result of this, the temperature coefficient of the thermal utilisation factor will be positive [11,12]. Secondly, it is a known fact that lighter nuclei (low atomic mass) such as hydrogen are much more effective in slowing down neutrons to the thermal energy range than heavy nuclei; in other words, lighter nuclei need fewer collisions to thermalise a neutron from 2x10⁶MeV to 1eV, compared to their heavier atomic mass counterparts [11]. Hence, the higher the density of hydrogen per unit volume, the greater the probability of scattering, from which it can be inferred that the more collisions a neutron encounters with hydrogen, the higher will be the fission rate and subsequently the higher the criticality will be.
BUC scenario
When BUC is taken into account in nuclear criticality safety analysis, it results in a reduction in criticality compared to when the same analysis is performed using a fresh fuel scenario. The reduction in burnup-dependent criticality has been found to be due to [4,18,19].
a. A decrease in the atom density of actinides that add a positive reactivity (235U)
b. An increase in the atom density of actinides that add positive reactivity (239Pu, 241Pu),
c. A decrease in the atom density of actinides with negative reactivity worth (238U) an increase in the atom density of actinides with negative reactivity worth (237Np, 234U, 236U, 238Pu, 240Pu 242Pu,241Am)
d. An increase in the atom density of fission products with negative worth (all FP).
The parameters analyzed using this approach are listed in their respective sections below. It is important to note that there is already a number of countries that take credit for burnup to reduce spent fuel storage space. For example, in the USA BUC for actinides has already been accepted by the Nuclear Regulatory Commission (NRC), as reported in NUREG/CR 6747: “The NRC interim staff guidance (ISG8) on Burn-up credit in storage/transport casks permits partial credit for Burn-up in PWR fuel. ISG8 limits credit for the Criticality reduction associated with Burn-up to that available from actinide compositions (i.e., actinide-only burn-up credit).”
Figure 8:Effect of increase in moderator density in Criticality.

Burn-up versus keff: The results obtained in this study, shown in Figure 9, indicate that at between 20 and 25GWD/MTU, there is an increase in keff. This is because the simulation was performed at a constant enrichment of 3.9wt%, which is too high for burnup lower than 30GWD/MTU. As such, in the early stages of the burnup cycle there is excess fuel and not enough burnup to give rise to an adequate concentration of fission products and actinides with parasitic absorption that will absorb neutrons to affect a decrease in keff. As a result, there is an increase in the keff in that region. As burnup increases, as was indicated in Figure 2, there is a gradual increase in the production of fission products 243Am, 237Np, 99Tc, 133Cs, 143Nd 145Nd, 147Sm, 150Sm, 151Sm, 152Sm, 151Eu, 153Eu, 155Gd, which are more effective as neutron absorbers and which were not present at the beginning of the cycle. As a result of this, there is a decrease in keff as burnup increases [4]. In addition, the results confirm findings that Major Actinides will have the smallest decrease in keff while Major Actinides+Principal Fission Products will have the largest decrease. This further confirms that when burnup increases, it will result in an increase in the yield of some fissile nuclides such as 239Pu and 241Pu, which will increase the keff, while others like 155Gd will tend to decrease it (Figure 2). If the fuel burnup is increased beyond the design limit of the FA, such as happens in thermal power uprates where the cladding for the anticipated burnup is not modified, there is a risk that the fuel cladding will begin to show signs of failure such as hairline cracks due to radiation-induced brittle fracture and suchlike around the top limit of its burnup, which for most of the existing cladding material like zirconiumtypes is in the region of 40-50GWD/MTU [12]. Above this range, the periphery of the fuel pellet will have increased so much as a result of the rim effect (Figure 10) that it will exert a great deal of pressure on the cladding material, eventually leading to fuelcladding mechanical interaction (FCMI) between the pellet and the cladding. Given that the FCMI occurs around a burnup of about 50 GWD/MTU [12], this will eventually result in fuel cladding failure which will lead to water ingress. As a result, the keff will then start to increase. It has also been observed that nuclear criticality and premature cladding failure are not the only concerns related to the increase in burnup that will have a negative impact on thermal power uprates. Others include an increase in radiation levels and increased decay heat generation, which are likely to be of concern if thermal power uprates proceed without proper plant modification.
Temperature versus keff: As the temperature of the fuel is increased, the keff will decrease as a result of doppler broadening. This is further confirmed in Figure 11, which shows that whichever nuclide set is used; they are all affected by temperature in the same way. As shown in Figure 11, relative to fresh fuel, the Major Actinides-Only burnup credits nuclide set reduces the keff quite substantially compared to fresh fuel. However, this is still very conservative compared to the other two nuclide sets, namely, Major Actinides+Minor Fission Products and Major Actinides+Principal Fission Products. According to Parks [17] in the USA authorization to conduct research on BUC was given as far back as 2001 by the US NRC through the issue of the Interim Staff Guidance 8 (ISG8).
Although research is being conducted on all three nuclides sets, it has become evident over a number of years that major actinides offers a much better safety margin compared to the other two sets. As such, the application of major actinides is generally preferred over other nuclide sets because of the size of the safety margin it allows the licensee before the regulatory limit of 0.95 is reached [10]. BUC analysis using Major Actinides+Principal Fission Products on the other hand will decrease the keff so much that it will allow more FAs to be stacked together, thus increasing the storage capacity of the cask and the SFP, which may seem to be a plausible solution to the shortage of spent fuel storage if one only looks at the normal operation of the cask. However, if one takes into consideration the abnormal operating conditions of the cask, where there could potentially be water ingress, this may not be such a great idea as it will reduce the safety margin to the extent that additional safety countermeasures would be required to prevent reactivity induced accidents. Calculations using data from Figure 11, at T=296K, show that relative to fresh fuel, the keff due to Major Actinides, Major Actinides+Minor Fission Products and that of Major Actinides+Principal Fission Products are 0.0507, 0.0606 and 0.1193, respectively. This is consistent with the results obtained by Wagner, which according to refs [6] and [16] translate to savings on storage space of 5.167%, 6.176% and 12.159% respectively.
Figure 9:Comparison of the keff of three BUC nuclide sets on the basis of burnup.

Figure 10:Rim effect in UO2 fuel [Hayes]..

Figure 11:Comparison of burnup credits obtained from different sets of nuclides [modelled at BU = 40 GWD/ MTU and 235U = 4.4wt%]..

Criticality as a function of enrichment: When one studies the graphs in Figure 7, it is observed that they follow the same trend as was seen in Figure 6; the keff increases, with an increase in enrichment as a result of an increase in the atom density of 235U. When one studies the effect of burnup on the keff using the same graph, it is observed that as burnup increases, the keff drops even further beyond the level it was when only the respective nuclide sets were taken into account in the calculations, thus increasing the number of FAs that comply with the regulatory requirements even more. In addition, it is also observed that between 3.1wt% and 4.4wt%, the Actinides + Minor Fission Products at the burnups 20, 30 and 40GWD/MTU drop the keff even lower than does Actinides + Principal Fission Products. This may be explained by considering that the analysis was performed at the fuel and moderator temperature of 300K and a cooling period of 10 years, as well as the fact that the analysis performed in ref [18], for which the results are summarized in Figure 12, where it is shown that between 5 and 50 years the keff will be in a downward trend because of the build-up of 241Am and 155Gd and the keff of the Actinides+Minor Fission Product is even lower than that of Actinides + Principal Fission Product.
Figure 12:Variation in keff as a function of cooling period (years)..

Therefore, the decrease of keff of Actinides + Minor Fission Products is because the 10-year cooling period falls within the period where there is a build-up of 241Am and 155Gd, which results in decreases in keff because of the huge absorption cross section. Therefore, based on the results of this analysis, when BUC is taken into account in nuclear criticality safety analysis, there is an economic benefit for the nuclear operator in that less spent fuel storage space is used than would have been the case had the analysis not taken them into account, while keeping criticality within the regulatory limits. This is because there is direct relationship between the decrease in keff that results from taking credit for burnup and an increase in the number of spent FAs that can be accommodated in the SFP or spent fuel cask as result of the storage space recovered/saved by taking credit for burnup than would have been the case if the fresh fuel approach were applied.
The phenomenon of BUC has been researched quite extensively in Japan, France and the USA. In the USA the results of this research have been published in various NUREG documents and as a result of the extensive research, the NRC has accepted analyses which take credit for burnup into account in nuclear criticality safety [1]. It is also important to note that apart from burnup, the variation in the concentration of the nuclides in a reactor core or cask is also influenced by the time factor, i.e. the duration of burnup or decay (Figures 3-5) [4,18]. It has also been demonstrated that not every nuclide contributes the same towards BUC [6]. As a result, BUC nuclides are grouped into three main nuclide sets [7,18]. Major Actinide, Major Actinides+Minor Fission Products, Major Actinides+Principal Fission Products, and a fourth set, Minor Actinides. The nuclides constituting each nuclide set are listed in Table 3.
The effect of the duration of the decay period in BUC application: The duration of the decay period plays a significant role in the position of the loading curves of analyses performed at different decay periods with respect to one another (Figure 13) and in the number of FAs acceptable for loading in the cask. This is because of the decay of short-lived nuclides, as well as the build-up of parasitic neutron absorbers. This will generally result in the decrease in keff associated with the length of the cooling period of the FA. To illustrate, consider FAs with an enrichment of 4.4wt% that have been irradiated in the reactor at a burnup of 40 GWD/MTU and a temperature of 400K. If only BUC of Major Actinides+Minor Fission Products is taken into consideration and the keff is plotted against the duration of cooling, it will result in the graph indicated in Figure 12; [18]. To understand why there are peaks and troughs in the graph, one would have to study these over a much shorter range, for example 50 years, as shown in Figure 14. Looking at Figure 14, it is noted that, in general, there is a decrease in keff over the entire period of 50 years. It is, however, observed that the decrease is steeper between 0 and 30 years than between 30 and 50 years. The decrease over the entire 50-year period may be ascribed to two opposing forces nuclear fission and absorption, with absorption dominating as a result of the build-up of fission products. The net effect will be the decrease in keff that is observed in Figure 14. When the graph is studied in detail for a shorter period than the time span given above, that is, 0-30 years and 30- 50 years, it is observed that keff varies with the duration of cooling as follows [4,18]. From 0 to 30 years: In the first thirty years there seems to be a notable decrease in keff which is ascribed to the decay of short-lived nuclides such as 252Cf (t1/2=2.65yrs), which undergo spontaneous fission, as well the decay of 241Pu (t1/2=14.290yrs.).
Figure 13:Effect of decay period on the loading curve (major actinides only).c.

Figure 14:Effect of cooling period in criticality: 0-50 years (Actinides + Minor Fission Products at [BU = 40 GWD/MTU, 235U = 4.4wt%]) [18]..

The build-up of
155Gd from 155Eu (t1/2 = 4.7 yrs.)
147Sm from 147 Pm (t1/2 =2.62 yrs.)
152Sm from 152 Eu (t1/2=13.54 yrs.)
241 Am from 241Pu (t1/2=14.29 yrs.)
133Cs from 133 Ba (t1/2= 10.51 yrs.)
Between 30 and 50 years: There is a gradual decrease in keff because all short-lived fissile nuclides have decayed and as a result the keff has reached saturation. The causes of various peaks and dips in the graph labelled (a) through to (f) are [18] as follows:
Region a is a decrease keff due to
a. Decay of 252Cf (t1/2 = 2.65yrs)
b. Build-up of 155Gd from beta decay of 155Eu (t1/2 = 4.7yrs)
c. Build-up of 147Sm from beta decay of 147Pm (t ½ = 2.62yrs)
Region b is a decrease in keff due to
a. Decay of 241Pu (t ½ = 14.290yrs)
b. Build-up of 152Sm (from 152Eu (t ½= 13.537yrs)
c. Build-up of 241Am (from 241Pu (t ½= 14.290)
d. Build-up of 133Cs (from EC of 133Ba (t ½= 10.51yrs) Region c is an increase in keff due to
a) SF6 of 244Cm (t ½= 18.11yrs)
Region d is a decrease keff due to
a) build-up of 145Nd (from EC7 of 145Pm (t ½= 17.7yrs)
Region e is an increase keff due to
a) SF of 243Cm (t ½= 29.1yrs)
Region f is a decrease in keff due to the build-up of 151Eu and 150Sm from neutron capture of 150Eu and EC of 150Eu (t ½=36.9yr) respectively. From 50 to 106 years: This period is better understood if divided into two-time frames. This is because there are periods when there is an increase in keff and periods where there is a decrease. If Figure 12 is divided into the time frames from 50 to 104 years and from 104 to 106 years, it is noted that the keff also changes for the following reasons:
From 50 to 104 years: During this time period there will be an increase in the keff due to decay of
a. 241Am (t½= 433yrs)
b. 240Pu (t½ = 6560yrs)
From 104 to 106: In this period, there is a decrease in keff as a result of decay of 239Pu (t1/2 = 2.411 x 10⁴yrs) which dominates the criticality. Based on this, the choice of the cooling period before loading into the cask is very important because if it is too long, i.e. more than 30 years, the keff may be in the upward trend of a cycle. The cooling period must therefore be taken into account whenever the loading curve of the casks is evaluated. This has further been confirmed by an analysis of the relation of keff versus the cooling period of all nuclides sets, as shown Figure 15.
Figure 15:Effect of change in isotopic composition on the loading curve (10-year decay period)..

Loading curves: When spent fuel assembly is to be loaded into the spent fuel cask, the decision as to whether it is suitable for loading or not is based on the loading curve of the cask, which may be described as a representation of the combination of burnup and the initial enrichment that corresponds to the limiting value of the keff for a given configuration, such as a cask or an SFP. Thus, the FA with insufficient burnup (i.e. with lower burnup than the limiting burnup obtained from the loading curve) is not acceptable for loading.
There are two important factors which characterize the loading curve of the cask:
a) The duration of the cooling period.
b) The isotopic composition of the nuclide set under consideration.
Therefore, the further below the limiting burnup value the misloaded cask is, the more critical the issue of exceeding the regulatory limit becomes.
A. Effect of the duration of the cooling period on the loading curve: The loading curve for a given nuclide set is a function of burnup, enrichment and the duration of the cooling period. The importance of the duration of the decay period in the loading curve is indicated in Figure 13, where it is clearly shown that the decay period is an important factor in locating the position of the loading curve with respect to one another, as well as the number of FAs acceptable for loading in the cask. The reason for this is that the decay of short-lived nuclides as well as the build-up of parasitic neutron absorbers will have an effect on the magnitude of the keff and, consequently, on the number of FAs that qualify for loading. Therefore, the choice of the duration of a cooling period is very important because if it is too long, i.e. more than 30 years, the keff may be in the upward trend of a cycle (Figures 12,14). The cooling period must therefore be taken into account whenever the loading curve of the casks is evaluated.
B. Effect of isotopic composition on the loading curve: Considering Figure 15, if the loading curve for major actinides is taken as a reference, it is noted that it lies above those of Major Actinides+Minor Fission Products, and Major Actinides+Principal Fission Products. This implies that if there is an increase in the number of nuclides with a higher absorption cross section, e.g. fission products, there will be more nuclides taking part in the absorption process and not enough fission taking place to sustain the reaction. As a result, fission products will result in lower keff than their actinide counterparts. If, on the other hand, the Major Actinides+Minor Fission Product is taken as a reference and we increase the amount of Major Actinides, there will be more fissile material such 239Pu, 240Pu, 241Pu and 242Pu available for fission; as a result, the keff will increase relative to that of other nuclides. Of the three sets, Major Actinides+Principal Fission Products (FP) has the largest BUC effect, i.e. it will decrease the keff of the system to a much lower level than the other two sets could achieve. Such broad qualification of cask contents requires an understanding of the effects of variations in reactor operating conditions and FA design characteristics on the criticality of SNF to establish justifiable assumptions for a BUC evaluation. A horizontal movement towards the right along the enrichment axis at a constant burnup implies that the increase in keff can only be achieved by an increase in the enrichment of fuel. If one combines the isotopic concentration, cooling time and burnup, one will obtain the loading curves indicated in Figure 16. The graph in Figure 16 shows that an increase in allowable BUC can lower the burnup enrichment loading curve and save storage space and the number of shipments. This can make a significant difference to the storage space in the SFP, the number of casks that must be acquired, and the number of shipments to be made to the ISFSF. A similar study conducted by Oak Ridge National Laboratory (ORNL) has shown that depending on the design of the cask, as much as 12% of the storage capacity can be saved, which is a significant saving in spent fuel storage space if implemented.
Figure 16:Comparison of loading curves of three nuclide sets at three different cooling times.

Sensitivity and Uncertainty Analysis
In this project, sensitivity and uncertainty analysis was performed in two separate techniques, the first being direct perturbation (DP), in which the parameter of interest was perturbed manually to determine what the effect of a small perturbation would be on the keff. The second analysis used TSUNAMI-3D sensitivity technique which is a forward/adjoint-based linear perturbation theory method used to calculated energy-dependent sensitivity coefficients.
Direct perturbation of fresh fuel parameters
The sensitivity and uncertainty analysis of fresh fuel was based on the DP technique described in [4,19], where KENO-VI was used to calculate keff. The resulting keff value was then used to calculate a total sensitivity coefficient (s), which is defined as the relative impact of a change in some nuclear data e.g. the macroscopic absorption cross section on the systems keff and is defined mathematically by Equation 6, [4] [19,20]. In addition, instead of using a three-point DP technique, a multipoint DP technique was used, which is described by [4,19,20]:
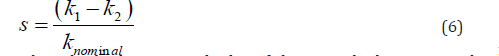
Where k1, k2, knominal are the keff of the perturbed system, and ρ1 and ρ2 are the perturbed values of the density of a nuclide, mixture, or region around the nominal density. The uncertainty coefficient is calculated using the following equation [20]:
Where σk1, σk1 and σknominal are the calculated standard deviations associated with k1, k2, and knominal.
The sensitivity of keff to a particular nuclide-reaction pair macroscopic cross section n referred to as a sensitivity coefficient, provides a measure of a first-order effect of perturbation in nuclear reaction x for nuclide n upon keff. A sensitivity coefficient is computed as a sum over all energy groups of the sensitivities of keff to a group-wise cross section. The study was divided into the following categories [19]:
a. Perturbation of 10B in the boral plate of the cask basket
b. Perturbation of moderator density
c. Perturbation of moderator temperature
d. Perturbation of polyethylene temperature
e. Perturbation of enrichment
The coefficients therefore directly reflect the relative importance of the data parameters for the results of a computer simulation. Studies conducted by Mueller et al. [20], have shown that TSUNAMI-3D and DP results should be within 1 or 2 standard deviations of each other.
Perturbation of 10B concentration: In this study, the fraction of 10B was taken as the nominal amount of 10B in the borated steel. It was then perturbed by ± 5% and ± 10% and in each case the effect of perturbation on the keff was recorded for further analysis using the DP techniques discussed earlier [4,19,20]. The results shown in Figure 17 indicate that as the fraction of 10B in the boral plates (or the poison panels as some authors call them) is increased, there is a corresponding decrease in keff until a saturation level is approached where no further decrease in keff can be achieved by any increase in 10B. This may be ascribed to the fact that the neutron population available for absorption by 10B has decreased so much that any excess of 10B will have no neutrons left to absorb. If one keeps on increasing the 10B concentration it will reach the point where the slope of the curve (i.e. the sensitivity) approaches zero but never actually gets to zero, which is a classic case of the nonlinear behavior that is exhibited by some materials [4,19]. When a polynomial fit was performed, three equations were obtained; however, the third-order polynomial was found to have the best fit (R2=0.99994), as the trend line fit captures all the data much better than any other equation above (Figure 18).
Figure 17:Perturbation of 10B concentration in the boral plate.

Third-order polynomial equation
y = A + B1x + B2x2 + B3x3
Where A: 1.08956, 9.27283E4
B1: 0.17676, 0.000355
B2: 0.11506, 0.00403
B3: 0.0281, 0.00403
R2 = 0.99994
SD = 3.01384
In addition, the third-order polynomial also has the lowest standard deviation of them all. It is therefore expected that the decrease in keff as the fraction of 10B is increased will follow the third-order polynomial described by [4,19]:
y = 1.08956 −0.17676x + 0.11506x2 − 0.0281x3(9)
The sensitivity coefficient can be obtained by calculating the derivative (slope) of this equation at a particular point. Applying the basic differentiation rule in calculus where if n is a positive integer and y is a function defined by y xn then the derivative is given by dy / dx = nxn −1 [21]. Therefore, the general equation for the sensitivity of keff to 10B concentration is given by,
2 dy / dx0.17676 0.23012x 0.0843x (10)
Therefore, at 10B(Ci/Cnom) = 1 (i.e. x = 1), then ki/knom will be, dy / dx1 0.030941 .101 0-04 (11)
which is the sensitivity coefficient at that concentration [14,15].
Perturbation of moderator density: When the density of water is increased, a linear relationship is observed between the density and the keff of the system. This is because the increase in water density results in an increase in the density of hydrogen atoms in the system. In addition, because light elements such as hydrogen have much greater moderation power than their heavier counterparts, e.g. oxygen in this case, they have a much greater propensity to slow down neutrons to their thermal energy range, thus increasing the rate of fission and thereby increasing the keff. The graphical relationship between these two parameters is shown in Fig.18, which is summarized mathematically by Eqn 12 [4,19]:
Y = 0.61451 0.3841x2 R = 0.99933
Perturbation of moderator and fuel temperatures: The results in Figure 19 indicate that perturbation of fuel and moderator temperatures results in a linear relationship between an increase in temperature in both materials and a decrease in the keff of the system [4,19]. This is largely due to the Doppler broadening effect of the temperature on the cross sections of the two materials. Since the two materials, i.e. fuel and moderator, have different absorption and capture cross sections, the mode of reaction with neutrons will also be different. In the fuel, 238U accounts for the largest fraction of Doppler broadening because the resonance escape probability and the negative temperature coefficient are more affected than in other materials. However, because of its fission cross section, 238U will tend to decrease the keff more slowly than the moderator would, as shown in Figure 19, hence a lower sensitivity coefficient (B = - 0.01195) compared to that of the moderator (B = -0.02527) [4,19].
Figure 18:Effect of perturbation of moderator density on keff..

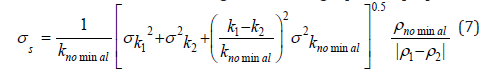
Sensitivity and uncertainty analysis of neutron multiplication factor to burnup using the direct perturbation technique: To determine the sensitivity of keff to burnup, a DP technique summarised by Eqn 6 and Eqn 7 was applied. It was found that the sensitivity of the keff of various nuclides sets to burnup obeys the following respective equations [14]:
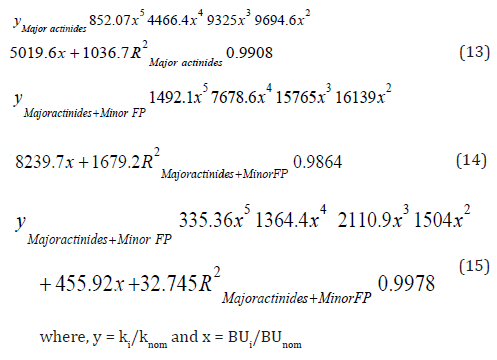
The study started with an initial enrichment of 3.9wt% and nominal burnup of 40GWD/MTU. The burnup was increased by values ranging from +/-2.5%, to +/-10% and in each case all three BUC nuclide sets were taken into account [4,19]. After each simulation the ki/knom and the Bui/Bunom were calculated using Eqn 6 and, instead of using Eqn 7 to calculate σs, the direct difference method was used. The results are indicated in Figure 20. It is observed that there is a decrease in keff as burnup increases. It is also, however, observed that the decrease is not uniform; at lower burnups between 36 GWD/MTU and 38 GWD/MTU it is much slower and between 40GWD/MTU and 43GWD/MTU it is much more rapid The relationship between ki/knom and Bui/Bunom and their respective correlation coefficients for all three nuclide sets is summarized mathematically by Eqn 13 through to Eqn 15. The total sensitivity coefficients of any of the nuclide sets indicated in the graph may be obtained by determining the differential of the respective equation at the point of interest [14,15-25].
Figure 19:Comparison of effects of perturbation of fuel and moderator temperature on keff. .

Figure 20:Sensitivity of the three nuclide sets to burnup used in the analysis of CASTOR X/28.

Perturbation of fuel enrichment: Based on the earlier discussion, the sensitivity coefficient of actinides is calculated:
Similarly, s for Actinides + Minor Fission Products and Actinides + Principal Fission Products is 0.26405 and 0.2479, respectively.
Discussion
Rationale for the increase in keff when enrichment is increased
When one looks at Figure 6 & 7, an increase in keff is observed as the enrichment increases. There are two main factors that may give rise to this.
The fast fission actor: The first of these factors is the increase in the fast neutron population as a result of the increase in enrichment. This will result in a corresponding increase in fast fission caused by neutrons in the fast energy range [11,12]. Therefore, the fast neutron population in one generation is increased by fast fission factor ε, which is represented mathematically as
The resonance escape probability: The second factor is a resonance escape probability (p), described mathematically as
As stated earlier, neutrons are born in a fast energy range and as they diffuse through the fuel they lose some of their energy by colliding with other material. As they continue to slow down when they pass through the resonance region of 238U, the probability p that they may be captured increases. This factor, i.e. p, is determined largely by the moderator-fuel arrangement, i.e. whether it is heterogeneous or homogeneous, and also by the enrichment. With regard to the influence of the moderator-fuel arrangement, it is important to realize that in order to undergo resonance absorption, the neutron must pass close enough to the 238U fuel to be absorbed. In a homogeneous fissile the neutron does its slowing down in the region of fuel nuclei, which makes this condition easily met, thus increasing the probability of capture. In a heterogeneous system like Castor X/28F (when functioning under normal operating conditions), the neutron slows down in the moderator where there are no 238U nuclei for absorption. As such, the neutron has a high probability of escaping the absorption. Thus, in a heterogeneous structure such as Castor X/28F, the increase in keff as enrichment increases noted in Figure 6 & 7 is a result of (Figure 20-22).
Figure 21:Sensitivity of various BUC nuclide sets to fuel enrichment.

Figure 22:Flux as a function of enrichment (20 GWD/MTU)..

a. An increase in 235U atom density, which implies that there is an increase in fission density [18], which will subsequently result in an increase in the Mean Free Path (MFP) of a neutron before it collides with other atoms (Figure 23).
b. A decrease in atom density of 238U, which implies low probability of resonance capture [11,12]. Furthermore, because the average neutron yield per fission (ν) for 238U is 2.8, whereas that of 235U is 2.4 (which is also an important element in the reproductive factor (η), which will be discussed in section 6.1.3), the decrease in 238U atom density will lead to a decrease in neutron flux as enrichment increases, as shown.
Figure 23:MFP as a function of enrichment (20GWD/MTU).

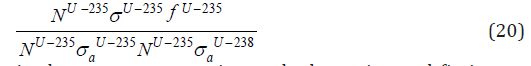
The reproductive factor: In addition to being affected by the fast fission factor (ε) and the resonance escape probability (p), the other factor which comes into play when enrichment of the fuel is increased is the reproductive factor (η), which is the ratio of the number of fast neutrons produced by thermal fission to the number of thermal neutrons absorbed in the fuel.
Considering that the rate at which fast neutrons are produced from thermal neutrons is given by a product of fission rate (U U) and the average number of neutrons produced per fission (ν8), and the fact that the rate at which thermal neutrons are absorbed by the fuel is given by (U U). When one takes into account the fact that there are several fissionable materials in a fuel and substitutes the above in Eqn 19, the result obtained is given as:
As the temperature varies, each absorption and fission cross section will vary accordingly depending on the nuclide in question. For the 235U, the cross section will vary according to the 1/v relationship but for 238U, the 1/v region is only applicable between the energies of 10-2 and 1eV. Between 1 and about 102 eV is the resonance peak. From about 102eV to 106eV is the fast neutron region. Therefore, as there temperature increases, there will be a decrease in p, because of doppler broadening in the 238U resonance peak and thus a decrease in keff. However, when one increases the enrichment of 235U, there is a decrease in 238U. Therefore, the effect of doppler broadening of the 238U cross section in effecting a decrease in keff is overcome by the increase in as a result of an increase in enrichment, making it more likely that a neutron will be absorbed by 235U to cause fission than it will be by 238U.
Decrease in keff as temperature increases
Once neutrons have been thermalized, they will continue to defuse throughout the reactor, and some may even leak out of the system. There are a number of factors that influence the keff when the temperature increases; one of them is the resonance escape probability, which has already been described above, and the other is the thermal utilisation factor.
The thermal utilisation factor (f): One of the factors which determine why the keff decreases when the temperature increases is the thermal utilisation factor (f) which is given by Eqn 21, which determines how well the neutrons are utilized within the reactor.
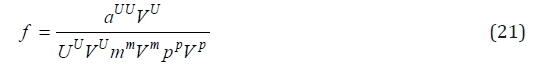
Where U, m and p refer to uranium, moderator and poison, respectively.
Since the absorption cross section varies with temperature, the thermal utilisation factor will also vary with temperature because of Doppler broadening. In a case when Castor X/28 F is filled with water, another factor which plays a major role is the density (ρ) of the moderator. When the temperature increases, the water moderator expands and a large amount of it will be forced out of the vessel, implying that the concentration of the moderator atoms available to absorb neutrons will be lower. As a result, the absorption rate will decrease. The number of moderator atoms in the vessel is calculated by equation [22]
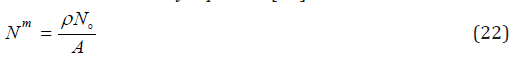
Where
ρ = density (g.cm3)
N0 = Avogadro’s number (6.023X10²³ mol-1)
A = atomic mass (g/mol) of the material.
The reduction in Nm results in an increase in thermal utilisation, as the moderator temperature increases because a neutron now has a better chance of colliding with a fuel atom. Because of this effect, the temperature for the thermal utilisation factor is positive.
Increase in keff with an increase in moderator density
When the moderator density is increased, as indicated in Figure 18, it will result in an increase in the number of moderator atom in the system. Since the macroscopic cross section for scattering is given by

Where σs is the microscopic scattering cross section (cm2/ nucleus), an increase in moderator density will give rise to an increase in the macroscopic scattering cross section (Equ 24). This in turn will result in an increase in the moderation power of a material given by equation (24)
s Moderating Power = Σ (24)
Therefore, an increase in moderator density will result in an increase in keff due to an increase in moderator power. Decrease in keff when BUC is taken into account When one studies the effect of taking credit for various BUC nuclide sets, indicated in Figures 7,9,11 & 12. it is observed that as one increases the number of nuclides in BUC analysis, so the keff decreases relative to the fresh fuel. The primary contributors to the decrease in keff are the decrease in f as a result of the increase in the denominator of Eqn 21. The decrease in p as a result of an increase in the number of nuclides with a high neutron absorption cross-section. In addition, the longer the duration of fuel storage (but not exceeding 50 years) the more the fuel will be depleted, which will subsequently result in a decrease in ε.
After 50 years, the keff will increase again (Figure 12) as a result of 50Gd reaching saturation point.
Conclusion
The results show that fresh fuel analyses result in a large safety margin and thus are preferred by nuclear regulators. Burnup credits analyses on the other hand have a smaller safety margin but are more economical, providing the nuclear operator with an opportunity for more storage space. They are therefore preferred by the nuclear operator. When comparing various nuclides, the results show that Major Actinides + Minor Fission Products nuclide sets can decrease the keff quite considerably compared to the Major Actinides Only nuclide sets and still leave a reasonable safety margin. On the other hand, taking credit for burnup of Major Actinides + Principal Fission products will decrease the keff to such low levels that one may be falsely tempted to stack as many FAs as closely as possible. However, this may prove dangerous if the probabilistic risk assessment of an accident that may lead to high reactivity has not been performed.
This scenario, that is, taking credit for Major Actinides + Principal Fission products described in the preceding paragraph, is one which the nuclear regulators refuse to contemplate, since it puts far too much pressure on the safety systems of spent fuel storage facilities. However, for the licensee, this would be a far better option since they could store FAs in the SFP as densely as they want, thus saving on the cost of transportation and/or storage. As a result, there would be more room for additional FAs if needed compared to Major Actinides. Accordingly, many nuclear regulators are often amenable to taking credit for burnup of Actinides only over other nuclide sets because of the extent of the safety margin it leaves them with before the regulatory limit of 0.95 is reached [10]. Thus, conservatism is the main reason why many nuclear regulators that have accepted BUC only accept Actinides only burnup credits. As Wagner indicates [6,7,15,16], the inclusion of fission products in BUC calculations will increase the number of acceptable FAs for cask loading from 11 to 58% [23-25]. This presents a significant increase in the number of acceptable FAs to be loaded in the casks and can buy the nuclear operator a fair amount of time and storage space while maintaining the safety margin within the regulatory limit. This will also allow for more spent fuel to be stored in a smaller space compared to that of fresh fuel, without violating the regulatory sub-criticality requirement of 0.95 for the safe storage of the fuel.
References
- NRC Interim Staff Guidance-8.
- Withee C, Carlson D (2000) Pent fuel burnup credit in casks: an NRC perspective. In Proceeding of the 27th Water Reactor Safety Information meeting held in Bethesda Mariott Hotell, Bethesda, Maryland, USA, pp. 419-436.
- Lee SH, Ahn JG, Hwang HR (2003-2019) Conceptual cask design with burnup credit. Korea Power Engineering, Daejeon, Korea, pp. 305-353.
- Leotlela M (2016) Criticality safety analysis of the design of spent fuel cask, its manipulation and placement. In: Barnby A (Ed.), A long-term storage. University of the Witwatersrand, Johannesburg, South Africa.
- Cousinou P, Lavarenne C, Biron D, Doucet M (2001) Taking burnup credit BUC into account in criticality studies: The situation as it is now and prospects for the future. Nuclear Engineering and Design 208: 205-214.
- Wagner J (2006) Evaluation of burnup credit for accommodating PWR spent nuclear fuel in high- capacity cask design. Oak Ridge National Laboratory, Oak Ridge, USA.
- Wagner J, Sanders E (2003) Assessment of reactivity margin and loading curves for PWR burnup credit cask designs. Oak Ridge National Laboratory, Oak Ridge, USA.
- IAEA (2007) Operation and maintenance of spent fuel storage and transportation casks/containers. IAEA, Vienna, Austria.
- IAEA (2003) Design of fuel handling and storage systems for nuclear power plants. International Atomic Energy Agency, Vienna, Austria.
- IAEA (2014) Criticality safety in the handling of fissile material. IAEA, Vienna, Austria.
- Duderstadt JJ, Hamilton LJ (1976) Nuclear reactor analysis. John Wiley and Sons, Michigan, USA.
- Lamarsh JR (2002) Introduction to nuclear reactor theory. American Nuclear Society, Illinois, USA.
- Leotlela M, Petr I, Taviv E (2015) Ranking of aluminum composite material for use as neutron absorber inserts in spent fuel pools. International Nuclear Safety Journal 4(3): 24-38.
- Leotlela M, Taviv E, Mkhize Z (2016) Preferential water ingress into a dry spent fuel cask. Journal of Nuclear Energy Science and Power Generation Technology 5(4).
- Wagner J, DeHart M, Parks C (2003) Recommendations for addressing axial burnup in PWR burnup credit. United States Nuclear Regulatory Commission, Washington, USA.
- Wagner J (2001) Computational benchmark for estimation of reactivity margin from fission products and minor actinides in PWR burnup credit. Oak Ridge National Laboratory, Oak Ridge, USA.
- Wagner J, DeHart M (2000) Review of axial burnup distribution considerations for burnup calculations. Oak Ridge National Laboratory, Oak Ridge, USA.
- Leotlela MJ, Olifant T, Petr I (2017) Time-dependent variation of the neutron multiplication factor in spent fuel storage. Kerntechnik 82(6).
- Leotlela MJ (2015) Sensitivity analysis of parameters important to nuclear criticality safety of Castor X/28F nuclear fuel cask. Kerntechnik 80(5): 485-493.
- Mueller D, Rearden B (2005) Sensitivity coefficient generation for burnup credit cask model using tsunami-3d. Knoxville, Tennessee, USA.
- Finney RL, George TJB (1990) Calculus, reading. Addison-Esley, USA.
- Leotlela MJ, Petr I, Malgas I (2015) Effect of the location of a misloaded fuel assembly on the neutron multiplication factor of castor X/28F spent fuel cask. International Nuclear Safety Journal 4(1): 5-10.
- Radulescu G, Gauld I (2009) Starbucs: A prototypic scale control module for automated criticality safety analyses using burnup credit. Oak Ridge National Laboratory, Oak Ridge, Tennessee, USA.
- IAEA (2011-2013) Methodology for a safety case of dual-purpose cask for storage and transportation. Vienna, Europe.
- Elam K, Wagner CPJC (2003) Effects of fuel failure on criticality and radiation dose for spent fuel casks. Oak Ridge National Laboratory, Oak Ridge, USA.
© 2019 Leotlela MJ. This is an open access article distributed under the terms of the Creative Commons Attribution License , which permits unrestricted use, distribution, and build upon your work non-commercially.
Editor In Chief


.jpg)


Signup for Newsletter

Quick Links
 Editorial Board Registrations
 Submit your Article
 Refer a Friend
 Advertise With Us
Our Recent Edition

.jpg)


Top Editors


.jpg)


.bmp)
.jpg)
.png)
.jpg)


.png)

.png)


.png)


Financial Support

Sponsors

Latest e-Books

Latest Video

 a Creative Commons Attribution 4.0 International License. Based on a work at www.crimsonpublishers.com.
Best viewed in
a Creative Commons Attribution 4.0 International License. Based on a work at www.crimsonpublishers.com.
Best viewed in