
- About Us
- Guidelines
-

The Author ensures that the research has been conducted responsibly and ethically with adherence to all relevant regulations. read more..
- For Authors
- For Reviewer
- Manuscript Guidelines
- Membership
-
- Journals
- Reprints
- e-Books
- Videos
- Indexing
- Contact Us
 COVID-19
- Submissions


Full Text
Research & Development in Material Science
Uphill Diffusion of Antioxidant in Cross-Linked Polyethylene
Yuan-Shang Chang* and Ali Mosleh*
Department of Materials Science and Engineering, University of California, USA
*Corresponding author: Yuan-Shang Chang, Department of Materials Science and Engineering, University of California, 420 Westwood Plaza, 3111 Engineering V, Los Angeles, CA 90095, USA
Submission: May 21, 2018;Published: July 10, 2018

ISSN: 2576-8840 Volume7 Issue1
Abstract
Cross-linked polyethylene (XLPE or PEX) is a major material for cable insulation. Antioxidant is usually used as a dopant added in XLPE to prevent the insulation from oxidation. However, the antioxidant diffuses out of an XLPE matrix during thermal ageing, which accelerates oxidation, causing the degradation of the insulation. Few models have been developed to represent the diffusion behavior of the antioxidant. One paper has reported that the antioxidant in XLPE migrates from low to high concentration but no explanation has been given. Starting with the theories of uphill diffusion and reaction-diffusion, this paper has developed a physics-based model explicating why the antioxidant migrates against the concentration gradient. In addition to the concentration, the activity coefficient (γ) of the antioxidant is also considered. With physical significance, this study mathematically proves the inhomogeneous distribution of the diffusing oxygen in XLPE makes γ a function of oxygen concentration. γ determines the driving force rendering the uphill diffusion of the antioxidant. Besides the γ function, the decomposition rate of the antioxidant has been modeled.
Keywords: Cable insulation; Thermal degradation; Aging; Cross-linked polyethylene; XLPE; PEX; Oxidation; Diffusion; Activity coefficient; Chemical potential; Antioxidant
Introduction
Figure 1: The experimental data of the relative concentration of the antioxidant (Nocrac-300) [2].

Cross-linked polyethylene (XLPE or PEX) is one of the major materials for the insulation of electric cables [1]. XLPE degrades due to thermal energy, which is a ubiquitous factor determining the rate of degradation. The degradation can render brittleness [2-12] and induce cracks on the insulating layer [13], which may cause shortcircuit resulting from the exposure of the metal core in a cable. The degradation of XLPE can be an issue concerning the safety of power plants [13-16]. Assessing the ageing of the insulation, degradation reactions and their kinetics are important not only in predicting the remaining life of a cable, but also in developing guidelines for the future design of electricity-transmitting devices and powergenerating stations. Oxidation is one of the dominant reactions that lead to the ageing of XLPE [17-19]. The root causes are thermal energy and oxygen. One solution to decelerating the oxidation is adding antioxidant into XLPE while manufacturing the insulation [17-19]. Antioxidant at sufficient concentration can suppress polyethylene from forming compounds with oxygen [2]. However, previous studies have indicated the amount of the antioxidant in XLPE decreases because the antioxidant “evaporates” out of the matrix due to thermal energy [2]. When the antioxidant is deficient, oxidation reactions speed up and the morphology of the oxide changes from homogeneous to heterogeneous degradation observed on a cross-section [2]. So far, few studies have been conducted to develop a quantitative equation representing the “evaporation” kinetics of the antioxidant in XLPE. Nevertheless, one paper used Fourier-transform infrared spectroscopy (FTIR) to perform thorough characterization on the concentration of the antioxidant and the profile of the oxide distributing from the surface to the core on the cross-section of a bulk XLPE [2]. The measured concentration of the antioxidant on a cross-section during thermal ageing is lower at the center and higher near the surface although the antioxidant diffuses outward. In other words, the paper shows the antioxidant diffuses against the concentration gradient. Figure 1 shows the distribution of the antioxidant (Nocrac-300) along the cross-section of a 2mm thick XLPE sheet with various durations in the thermal ageing at 135 °C [2].
The distribution is convex instead of concave, which is considered “unexpected” in the paper [2]. There is a specific term called uphill diffusion [20] for describing this phenomenon: diffusion species move from lower to higher concentration against the concentration gradient because the chemical potential [21] determined by activity is relatively lower at the location with higher concentration, and a matter always migrates from the position with higher activity to the location with lower activity. To understand and quantify the “unexpected” trend of the antioxidant in XLPE, the activity of the antioxidant is discussed in our research. Based on Fick’s Law, this article has developed a model to bridge the activity and the concentration of the antioxidant by introducing a dynamic activity coefficient, which is a function of oxygen concentration. Besides, the model provides a way to quantify the decomposition rate of the antioxidant. It represents the decomposition ratio of an antioxidant exposed to external energy for a given period of time. With this model, the diffusion behavior and decomposition rate of the antioxidant in a bulk XLPE can be quantified.
Modeling
To model the activity coefficient of the antioxidant as a function of oxygen concentration, first, the trend of the activity coefficient with respect to the oxygen concentration in XLPE must be clarified. The second step is to model the profile of the activity of the antioxidant. Third, the profile of the oxygen concentration need be formulized. The last step is to find the correlation between the activity coefficient and oxygen concentration.
Trend of activity coefficient
The concept of this model is based on the difference of activity rather than the gradient of concentration. Activity, not solely concentration, determines the driving force making a diffusion species migrate. The relation between the activity (Ca) and the concentration (X) of the antioxidant can be represented by equation (1) [22].
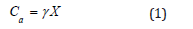
Where γ is the activity coefficient of the antioxidant. Since the molecules of the antioxidant move from the core toward the surface and evaporate out of an XLPE specimen, the activity at the center must be higher than the activity near the surface. In Figure 1, X at the surface is relatively high while the activity is lower. Therefore, according to equation (1), γ must be small near the surface. By the same token, the value of γ at the center shall be higher. The physical significance of γ is that it represents the interaction between the antioxidant and the environment in a matrix. The concentration of oxygen is a factor making the environment inhomogeneous in a bulk XLPE. Oxygen in the air can infiltrate into the bulk by diffusion. This diffusion process renders higher oxygen concentration at a sample surface [23,24] where γ is small. On the contrary, lower oxygen concentration occurs near the core of the XLPE sample where γ would be higher. The correlation between oxygen concentration and γ is the major assumption of this article, which is represented by equation (2). This assumption has been proved in the section on validation with experimental data.
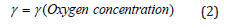
In summary, equation (2) states γ is a function of oxygen concentration, and the decrease of γ is caused by the increase of oxygen concentration resulting from the diffusion of oxygen from the atmosphere.
Profile of antioxidant activity
The antioxidant dissipates out of XLPE by diffusion. This suggests the profile of the activity of the antioxidant follows
Fick’s Law, or equation (3):
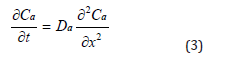
where t is time, Da is the diffusivity, and x is the position on a cross-section.
Besides diffusing out of a bulk XLPE, the antioxidant can decompose due to thermal degradation. Namely, the activity of the antioxidant can be compromised by thermal ageing. Therefore, according to reaction- diffusion theory [25], equation (3) cannot completely represent the behavior of the antioxidant, and need be further modified into equation (4).
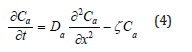
where ζ is the decomposition rate of the antioxidant in the unit of [1/time]. The value of ζ is between 0 and 1. The boundary conditions for equation (4) are: Ca(x,0)=Ca0, Ca(0,t)=0, Ca(L,t)=0, and Ca(x,∞)=0. Ca0 is the initial
concentration of the antioxidant. L is the thickness of a sample. By applying Separation of Variables and Fourier Series [23,24], the solution of equation (4) can be represented by equation (5).
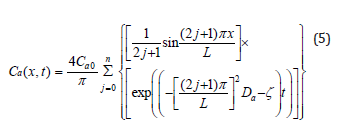
Figure 2: An example of the activity of the antioxidant plotted by equation (5).

To visualize the trend of the activity (Ca), equation (5) is plotted in Figure 2 where Ca0=6.93, L=2mm, Da=2.3×10⁻¹³m2/s, and ζ=3.4×10⁻⁷/s, for example.
Profile of oxygen concentration
The profile of the oxygen concentration in a bulk XLPE can be measured by analyzing the concentration of the carboxylic groups, or the oxidation products, [2,26] on the cross-section of an XLPE sample. To be more specific, in the 6/20 section on validation, the experimental data of the oxidation products [2] shows that the profile of the oxidation products is linearly proportional to the oxygen concentration modeled by Fick’s Law. In other words, the diffusion profile of oxygen modeled by Fick’s Law and the concentration profile of the oxidation products have the same trend. Experimentally, the relative concentration of the oxidation products can be measured by FTIR [2,26]. As for the diffusion of oxygen in a bulk XLPE, Fick’s Law in the form of equation (6) can represent the concentration profile of oxygen (Cx).
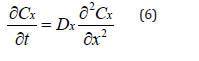
Where Dx is the diffusivity.
The boundary conditions for equation (6) are: Cx(x,0)=0, Cx(0,t)=Cx0, Cx(L,t)=Cx0, and Ca(x,∞)=Cx0. Cx0 is the concentration of oxygen at the surface of a sample where x=0 or L. Cx0 is fixed by the constant ingredient of the atmosphere. L is the thickness of a sample. By applying Separation of Variables and Fourier Series [23,24], the solution of equation (6) can be represented by equation (7).
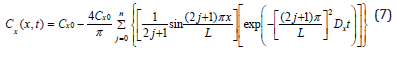
In the section on validation, it has been shown that the profile plotted by equation (7) is linearly proportional to the distribution of the oxidation products measured by FTIR.
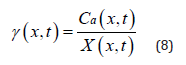
Function of activity coefficient
To solve γ function represented by equation (2), X(x,t) and Ca(x,t) in equation (1) need be determined. Applying FTIR is one method to measure X(x,t). Ca(x,t) can be modeled by equation (5). Therefore, according to equation (1), γ(x,t) can be expressed by equation (8):
Since the goal of this section is to prove equation (2), the oxygen concentration in the equation must be calculated. Equation (7) can model the oxygen concentration in the parentheses of equation (2). Moreover, equation (7) can also be validated by using FTIR to measure the distribution of the carboxylic groups on the crosssection of an XLPE sample [2,26].The reason and proof are stated in sections 2.3 and 3.2, respectively. The final step is to use a Cartesian coordinate to plot the values of γ(x,t) determined by equation (8) on the y-axis, and the corresponding values of the oxygen concentration calculated by equation (7) on the x-axis. Once the ζ in equation (5) is determined, it can be shown that γ is a function of the oxygen concentration in XLPE but independent of time, which justifies that γ is the driving force rendering the uphill diffusion of the antioxidant. Detailed processes of these calculations have been demonstrated in the section on validation.
Validation
The experimental data used to validate our models are from a published paper [2]. The antioxidant is Nocrac-300 [2]. For the observation of the behavior of the antioxidant, the XLPE matrix is doped with the antioxidant at 1phr under 135 °C thermal ageing for 800 hours. For the measurement of the oxidation products, the same XLPE matrix is adopted but no Nocrac-300 is added. The oxidation products are measured after 135 °C thermal ageing for 400 hours.
Antioxidant activity profile
The activity of the antioxidant can be modeled by equation (5). In order to be consistent with [2], Ca0 is set at 6.93 since this value is the initial concentration (X) of the antioxidant. Then, according to equation (8), γ=(Ca0=6.93)÷(X=6.93)=1. In other words, the maximum value of γ is one because γ decreases when oxygen concentration increases during ageing. Other initial values for γ would not alter the result of the modeling. Setting the initial value of γ at one is for the convenience of the calculation. The thickness of the XLPE sample is 2mm. n is set at 100 for approximation. Mathematically, when j is larger than 5, the summation terms in equation (5) become indiscernible. Therefore, setting n at 100 is pertinent. As for Da, values should be tested to make the value of Ca (1mm, 200h) calculated by equation (5) slightly less than the corresponding experimental result at x 1mm and t=200h, which is emphasized by the dotted-line circle in Figure 3 [2], oxide concentration at (x=1mm, t=200h) is still low. Therefore, it can be assumed that the value of γ in equation (1) is only slightly less than 1 since the oxygen concentration at the center is still relatively low at the beginning of the experiment. In other words, the activity of antioxidant has not been compromised too much at the center of the cross-section when the concentration of oxygen is still low. To visualize this, Figure 3 shows the lines plotted by equation (5). In this condition, Da in equation (5) has been determined to be 2.3×10- 13m2/s. ζ is tentatively set at 0 and will be corrected later. γ(x,t) can be calculated by equation (8) based on the values of Ca(x,t) and X(x,t) read from Figure 3.
Figure 3:Continuous lines: modeled activity plotted by equation (5). Discrete patterns: the concentration of the antioxidant measured by FTIR [2].

Oxygen concentration profile
Figure 4:Continuous lines: modeled activity plotted by equation (5). Discrete patterns: the concentration of the antioxidant measured by FTIR [2].

Section 3.1 has determined γ(x,t). To find the correlation between γ and oxygen concentration, equation (7) can be applied to quantify the oxygen concentration. The discrete patterns in Figure 4 are the experimental data of the distribution of the oxidation products in the XLPE sample measured by FTIR [2]. The concentration of the oxidation products measured by FTIR is not equal to the concentration of the oxygen modeled by equation (7). However, continuous lines plotted by equation (7) can fit the experimental data denoted by the discrete patterns shown in Figure 4. This result means the concentration of the oxidation products is linearly proportional to the concentration of the oxygen diffusing in a bulk XLPE. In other words, in the XLPE where the antioxidant is deficient, the oxidation reaction is controlled by the diffusion kinetics of the oxygen migrating from the atmosphere into the core of the sample.
The thickness (L) in equation (7) is 2mm. The value of the extrapolation of the experimental data at x=0mm and x=2.0mm in Figure 4 is 5. To be consistent with the experimental data, Cx0 in equation (7) is set at 5. Setting Cx0 at 5 is only for the convenience of the calculation. Cx0 at different values would not alter the trend of equation (7) since it is a proportional constant in the equation. When j in the equation is larger than 5, the summation terms are too small to be discernible. Hence, setting n at 100 is pertinent for the approximation. After testing different values of Dx, continuous lines plotted by equation (7) with Dx at 2.28×10⁻¹³m2/s can properly fit the experimental data denoted by the discrete patterns shown in Figure 4.
Activity coefficient
Section 3.1 determined the values of γ(x,t). Section 3.2 quantified Cx(x,t) on the cross-section of the bulk XLPE. This section correlates γ with Cx by starting with the linear fitting in Figure 5. Four sets of experimental data are plotted with respect to different ageing time in Figure 5. Linear fitting has been applied to each data set. The coefficients, a and b, of the linear functions representing the straight lines in Figure 5 are listed in Table 1. The R2 value of each linear fitting is also shown in the Table 1. High values of R2 suggest strong correlation between γ with Cx. Negative slopes of the linear functions indicate the activity coefficient of the antioxidant decreases when the oxygen concentration increases. However, Figure 5 reflects γ is a function of oxygen concentration and time, which does not conform to the preliminary assumption that γ is a function of only oxygen concentration. This is because the value of ζ in equation (5) has not been determined. To be more specific, all the previous calculations have tentatively set ζ=0. To determine the correct ζ value, a γ-Cx graph similar to Figure 5 is plotted. However, different from Figure 5, all the discrete points (squares, triangles, circles, and rhombuses) in Figure 5 are combined into one data set shown in Figure 6 where different ζ values from 0 to 1 are plugged into equation (5) to determine the corresponding γ calculated by equation (8). In each new γ-Cx plot such as Figure 6, a linear fitting is applied to all the points in order to obtain an R2 value. Each ζ value corresponds to one R2 value, which is shown in Figure 6. When ζ=3.2×10⁻⁷/sec, the highest R2 value is located, which is shown in Figure 6. In this condition, γ as a function of oxygen concentration is represented by equation (9).
Table 1:The coefficients, a and b, of the linear equation (y = a . x + b) corresponding to each straight line in Figure 5.

Figure 5:The correlation between activity coefficient (γ) and modeled oxygen concentration (Cx) before the decomposition rate (ζ) is anchored.

Figure 6:Testing different ζ values to maximize R2.

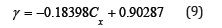
This result directly concludes that the activity coefficient (γ) is linearly proportional to the oxygen concentration (Cx) with a negative slope. Hence, equation (2) has been solved and can be rewritten into equation (9).
Discussion
The experimental data shown in Figure 1 indicate that the amount of the antioxidant decreases when the XLPE matrix is under thermal ageing. There are at least two root causes: the diffusion of the antioxidant molecules and the decomposition of the antioxidant. Diffusion makes the antioxidant migrate from the center to the surface of the matrix, and dissipate in the air. On the other hand, the antioxidant molecule can decompose; the decomposed molecule may react with a substance in the matrix, such as oxygen inducing oxidation. Both diffusion and decomposition make FTIR detect less antioxidant left in the XLPE matrix. Diffusion kinetics can be modeled by Fick’s Law. At the very beginning of the derivation of 1-D Fick’s Law, diffusion species can be represented by the dots in Figure 7 [27]. The lines in the figure mean planes whose normals are perpendicular to the normal of this paper. If each dot has the same probability to migrate from one plane to the adjacent planes, the net flux of the dots shall be from plane A to plane D since the concentration of the dots is higher in plane A and decreases from plane A to plane D. This process renders diffusion from high to low concentration.
Figure 7:Illustration of 1-D diffusion mechanism.

Namely, diffusion goes from the left to the right of Figure 7. However, this diffusion direction is certain only when the matrix is homogeneous, or the migration probability of each dot is the same. In other words, if the migration probability of the dots in plane D is high and gradually decreases from plane D to plane A, the net flux of diffusion may become from the right to the left, which is termed uphill diffusion [20]: diffusion from low to high concentration. The physical significance of the migration probability means the interaction between the diffusing species and the matrix. In the viewpoint of energy, when the dots in plane A of Figure 7 are stable, the migration frequency of the dots shall be low. For instance, if the density of certain defects is high in plane A and decreases from plane A to plane D, diffusing species may move from the right to the left. This is a very common phenomenon in materials since a defect always provides a site with a lower energy state. In thermodynamics, one way to quantify the migration probability is to introduce the concept of activity. Activity can be regarded as “effective” concentration. As shown in equation (1) [22], activity (Ca) is based on the concentration (X) and modified by activity coefficient (γ). The role of γ is to determine the “effective” concentration contributing to the change of Gibbs free energy. In other words, while the dots in plane A of Figure 7 are trapped by the high density of certain defects, it renders low migration probability to the dots, which means the “effective” concentration of the dots in plane A is low. Fewer dots per unit time can migrate away from plane A and contribute to the diffusion. To extend the concept of Figure 1-7, the migration of the dots can be viewed as being similar to the diffusion of the antioxidant in the XLPE matrix. In Figure 7, plane A is like the location near the surface while plane D is analogous to the position at the core of the XLPE sample corresponding to Figure 1.
The concentration of the dots (representing the antioxidant molecules) in plane A is higher than the concentration in plane D. Although the concentration of the antioxidant is higher near plane A and decreases from plane A to plane D, the net flux of the antioxidant can still flow from plane D to plane A against concentration gradient as long as the concentration of oxygen in plane A is higher. This is because oxygen can lower the migration probability of the antioxidant molecule. In other words, the activity of the antioxidant near the surface is significantly compromised by the molecules of the diffusing oxygen from the air. Namely, the antioxidant near oxygen has a lower energy state compared to the antioxidant far from an oxygen molecule. This correlation is formulized by equation (2) and quantified by equation (9). Based on the concept of activity derived from the migration behavior of a diffusing species, the nominators of Fick’s Law represented by equation (2) have been denoted by activity (Ca) instead of solely concentration, which means the “effective” concentration shall be considered.
In addition to diffusion driven by activity, the loss of the antioxidant can also result from the decomposition of the antioxidant itself. The ageing temperature discussed in this study is 135 °C. The melting temperature of the antioxidant is 150-165 °C. Hence, the molecular chains in the antioxidant can decompose and react with oxygen, XLPE, or other species in the environment. Therefore, equation (3) shall be modified by the reaction-diffusion theory represented by equation (4) [25]. The value of ζ in equation (4) has been determined at 3.2×10⁻⁷/sec in section 3.3. It means in every second, ζ portion of the antioxidant decomposes. Without diffusion, the amount of the decomposition ratio (Vd) in the first 100 hours can be calculated by equation (10) [28].
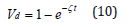
where t=100×60×60 seconds. Equation (10) means in the first 100 hours, if there is no diffusion, 11% of the original antioxidant is decomposed due to the thermal ageing. When both the diffusion and the decomposition contribute to the loss of the activity of the antioxidant, the accumulating loss of the activity can be determined by integrating equation (5), the solution of equation (4). Section 2.3 and 3.2 have shown that the concentration of the oxidation products is linearly proportional to the diffusion profile represented by equation (7), which is the solution of Fick’s Law expressed by equation (6). In this study, the diffusion species of equation (6) is assumed to be oxygen although other diffusion species can be modeled by this equation as well. However, since oxygen is an essential reactant in oxidation reactions and oxygen can be constantly supplied from the atmosphere, the assumption based on the diffusing oxygen is pertinent. The main purpose of this research is to quantify the uphill diffusion of the antioxidant based on the activity. The activity is determined by the activity coefficient (γ), which has been shown linearly proportional to the oxygen concentration with a negative slope. This correlation means when the antioxidant and oxygen are spatially close to each other, their total energy becomes lower. A previous study provided a result conforming to our research [19]. The paper reported: in the vicinity of the antioxidant molecule, the probability of the oxidation reaction caused by oxygen and the polymer matrix decreases. This may suggest that the antioxidant can increase the total energy between oxygen and the polymer, or, on the other hand, the energy between oxygen and the antioxidant is lower than the energy between oxygen and the polymer. In other words, the antioxidant is competing with the polymer in order to attract oxygen. Moreover, it has been reported that the antioxidant can spontaneously oxidize [29] and combust [30] in the air, which means the antioxidant tends to attract oxygen. These are evidence proving that the activity of the antioxidant decreases when oxygen presents.
Conclusion
The proposed model is based on activity rather than concentration to explain the uphill diffusion of the antioxidant in XLPE. Experimental data have been incorporated into this research to validate the proposed models. Activity is the driving force of diffusion. Concentration can affect activity, but the two should not be viewed equally. Their relation is bridged by activity coefficient (γ). The diffusion of the antioxidant from low to high concentration is caused by the lower γ at the position with higher concentration. The unevenly distributed γ in an XLPE matrix results from the diffusing profile of oxygen from the air. Diffusion kinetics renders higher oxygen concentration near a sample surface. The presence of oxygen can lower the γ of the antioxidant. Models shall be developed to determine γ as a function of oxygen concentration by formulating the profiles of the activity and oxygen. Besides by uphill diffusion, the XLPE matrix loses the antioxidant by the decomposition of the antioxidant itself.
Fick’s Law and a reaction-diffusion equation have been applied to determine the activity of the antioxidant as a function of time and position. On the other hand, to determine the concentration profile of the oxygen in an XLPE matrix, the distribution of the oxidation products is measured by FTIR and modeled by diffusion kinetics. The experimental data show the concentration of the oxidation products is linearly proportional to the concentration of the diffusing oxygen which can be quantified by Fick’s Law. According to the activity profile and the measured concentration of the antioxidant, γ can be determined. Once γ is plotted against oxygen concentration, we can conclude that γ is linearly proportional to the oxygen concentration with a negative slope. Physical significance reported in the literature also supports this result. Moreover, this model is not restricted to a linear correlation between γ and the variables of γ. Further modification can be applied to this model to cater to different diffusion species due to the generic nature of the approaches adopted in our research.
Acknowledgment
The results presented in this paper are based on the research conducted as a part of the project entitled Physics- Based Probabilistic Model of the Effects of Ionizing Radiation on Polymeric Insulators of Electric Cables used in Nuclear Power Plants, supported by the U.S. Department of Energy’s Consolidated Innovative Nuclear Research Program.
References
- Bustard L, Holzman P (1994) Low-voltage environmentally-qualified cable license renewal industry report: Revision 1. Final report. Electric Power Research Institute, Palo Alto, California, USA.
- Shimada A, Sugimoto M, Kudoh H, Tamura K, Seguchi T (2013) Degradation distribution in insulation materials of cables by accelerated thermal and radiation ageing. IEEE Trans Dielectr Electr Insul 20(6): 2107-2116.
- Chang YS, Mosleh A (2017) Predictive model of the degradation of cable insulation subject to radiation and temperature. International Topical Meeting on Probabilistic Safety Assessment and Analysis (PSA), Pittsburgh, Pennsylvania, USA, pp. 1-15.
- Chang YS, Mosleh A (2017) Physics-based model of the degradation of cable insulation subject to radiation and heat. IEEE Conference on Electrical Insulation and Dielectric Phenomenon, Fort Worth, Texas, USA.
- Chang YS, Mosleh A (2017) Probabilistic degradation models for cable insulation in nuclear power plants. ANS Winter Meeting and Nuclear Technology Expo, Washington, USA, 117: 642-645.
- Ohki Y, Kotani H, Fujishima D, Hirai N (2017) Similarity in degradation behavior by heat and irradiation between ethylene-propylene-diene rubber and silicone rubber. IEEE Conference on Electrical Insulation and Dielectric Phenomenon, Fort Worth, Texas, USA.
- Šarac T, Quiévy N, Gusarov A, Konstantinović M (2016) The study of temperature and radiation induced degradation of cable polymers: A comparison between the mechanical properties of industrial and neat EPDM. Procedia Structural Integrity 2: 2405-2414.
- Šarac T, Quiévy N, Gusarov A, Konstantinović M (2016) Influence of γ-irradiation and temperature on the mechanical properties of EPDM cable insulation. Radiat Phys Chem 125: 151-155.
- Fifield L (2017) Tracking aging in nuclear electrical cable polymers. ANS Winter Meeting and Nuclear Technology Expo, Washington, USA.
- Liu S, Fifield LS, Bowler N (2016) Towards aging mechanisms of crosslinked polyethylene (XLPE) cable insulation materials in nuclear power plants. IEEE Conference on Electrical Insulation and Dielectric Phenomena (CEIDP), Toronto, Canada, USA.
- Simmons K, Fifield L, Westman M, Tedeschi J, Jones A, et al. (2014) Determining remaining useful life of aging cables in nuclear power plants-interim status for FY2014. Pacific Northwest National Laboratory, Richland, Washington, USA.
- Duckworth R, Davis S (2017) Consequence of activation energy and mechanical properties in harvested i&c cables. Transactions of the American Nuclear Society, Washington, USA, p. 117.
- IAEA (2000) Assessment and management of ageing of major nuclear power plant components important to safety: In-containment instrumentation and control cables. Volume 1, International Atomic Energy Agency, Vienna, Austria.
- IAEA (2000) Assessment and management of ageing of major nuclear power plant components important to safety: In-containment instrumentation and control cables. Volume 2, International Atomic Energy Agency, Vienna, Austria.
- Yamamoto T (2006) The interim report of the project of assessment of cable aging for nuclear power plants. Japan Nuclear Energy Safety Organization, JNES-SS-0619, Tokyo, Japan.
- Yamamoto T, Minakawa, T (2009) The final report of the project of assessment of cable aging for nuclear power plants. Japan Nuclear Energy Safety Organization, JNES-SS-0903, Tokyo, Japan.
- Matsumoto S (1983) Behavior of antioxidant in polyethylene. J Polym Sci Part A: Polym Chem 21(2): 557-564.
- Viebke J, Gedde U (1997) Antioxidant diffusion in polyethylene hotwater pipes. Polym Eng Sci 37(5): 896-911.
- Seguchi T, Tamura K, Shimada A, Sugimoto M, Kudoh H (2012) Mechanism of antioxidant interaction on polymer oxidation by thermal and radiation ageing. Radiat Phys Chem 81(11): 1747-1751.
- Darken L (1948) Diffusion of carbon in austenite with a discontinuity in composition. Trans Aime, Philadelphia, Pennsylvania, USA.
- Tu K, Liu Y, Li M (2017) Effect of Joule heating and current crowding on electromigration in mobile technology. Appl Phys Rev 4(1).
- Gaskell DR (1995) Introduction to the Thermodynamics of Materials. (3rd edn), Taylor & Francis, Washington, USA.
- Balluffi RW, Allen S, Carter WC (2005) Kinetics of materials. John Wiley & Sons, Inc, New Jersey, USA.
- Jackson KA (2004) Kinetic processes crystal growth, diffusion, and phase transitions in materials. WILEY-VCH Verlag GmbH & Co. KGaA, Weinheim, Germany.
- Britton NF (1986) Reaction-diffusion equations and their applications to biology. Academic Press, Orlando, Florida, USA.
- Sugimoto M, Shimada A, Kudoh H, Tamura K, Seguchi T (2013) Product analysis for polyethylene degradation by radiation and thermal ageing. Radiat Phys Chem 82: 69-73.
- Porter DA, Easterling KE (2001) Phase transformations in metals and alloys. (2nd edn), Nelson Thornes Ltd, Cheltenham, UK.
- Navidi W (2009) Statistics for engineers and scientists. (3rd edn), McGraw-Hill, New York, USA.
- CAS Data Base List : 4,4’-Thiobis(6-tert-butyl-m-cresol).
- Chemical Data sheet: 4,4’-Thiobis(6-tert-butyl-m-cresol).
© 2018 Yuan-Shang Chang. This is an open access article distributed under the terms of the Creative Commons Attribution License , which permits unrestricted use, distribution, and build upon your work non-commercially.
Editor In Chief


.jpg)


Signup for Newsletter

Quick Links
 Editorial Board Registrations
 Submit your Article
 Refer a Friend
 Advertise With Us
Our Recent Edition

.jpg)


Top Editors


.jpg)


.bmp)
.jpg)
.png)
.jpg)


.png)

.png)


.png)


Financial Support

Sponsors

Latest e-Books

Latest Video

 a Creative Commons Attribution 4.0 International License. Based on a work at www.crimsonpublishers.com.
Best viewed in
a Creative Commons Attribution 4.0 International License. Based on a work at www.crimsonpublishers.com.
Best viewed in