- Submissions

Full Text
Research & Development in Material Science
A New Concept of using Transverse Loading to Characterize Environmental Stress Cracking Resistance (ESCR) of Polyethylene (PE)
PY Ben Jar*
Department of Mechanical Engineering, University of Alberta, Canada
*Corresponding author: PY Ben Jar, Department of Mechanical Engineering, University of Alberta, Edmonton, Alberta, Canada
Submission: December 12, 2017; Published: February 23, 2018

ISSN: 2576-8840Volume3 Issue5
Abstract
The overall objective of the study is to develop a new approach to characterizing environmental stress cracking resistance (ESCR) of polyethylene (PE) without using any pre-notch to accelerate crack growth. This paper presents a concept that uses an indenter to apply transverse loading to create local stretch in the region around the indenter. Cracks are initiated by the local stretch and time for the crack growth to the neighboring low-strain region, at a constant deflection and in a 10% Igepal CO-630 solution at 50 °C, is used to characterize ESCR for PE. The concept is verified by testing four types of PE, two high-density PE and two linear-low-density PE, of which ESCR has been characterized using ASTM D1693-A. Results show that even using much thicker specimens (10mm compared to 3mm) [1], time for crack growth based on the new concept is much shorter, especially for PE with strong ESCR. This supports the feasibility of using the new concept to characterize PE's ESCR in a shorter timeframe than that required for ATSM D1693-A.
Keywords: Polyethylene; ESCR; Transverse loading; Mechanical testing
Introduction
Environmental stress cracking (ESC) is a phenomenon that has seriously limited semi-crystalline polymers such as polyethylene (PE) for load-bearing applications [2]. PE is known for its excellent chemical resistance and reasonable mechanical strength, and is widely used in low-stress applications such as food containers, plastic pipes, and liner for steel pipes and tanks. Although PE has good chemical resistance, it suffers from cracking in an environment that contains soaps, wetting agents, oils, or detergents. As a result, ESC resistance (ESCR) is an important property for evaluating suitability of PE for load-bearing applications.
Current methods to evaluate ESCR for PE are based on crack growth in an environment that contains aggressive agents [3,4]. Most methods, such as ASTM D1693, ASTM D1473, ASTM F2136, ISO 13479, ISO 16770 and ISO 22088 [5], rely on a pre-notch in specimens to accelerate crack growth. However, even with a prenotch, a long duration (sometimes more than 1000 hours) could be needed to develop crack growth in some PEs, especially those used for pipe applications. In addition, results for the notched specimens may have significant scattering [6,7], thus raising concerns about their validity for evaluating ESCR. In view of those concerns, a study has been conducted to search for an alternative approach to characterize ESCR for PE. The new approach should use specimens without any pre-notch, and time required for crack growth should be shorter than that from test methods that are currently available. In this study, ESCR from ASTM D1693 [1], condition A, is used to evaluate the new approach.
It should be noted that some of the current standard test methods for ESCR characterization, such as ISO 22088-2 (Method A), does not require any pre-notch introduced to the specimens. However, multiple tests subjected to different loading levels are required, in order to obtain a range of failure time based on which interpolation is used to determine the loading level for crack development in 100 hours. Such a try-and-error process to determine the proper loading level for the ESCR characterization can be very time-consuming.
In addition to the afore-mentioned test methods that use an aggressive environment to accelerate crack development for the ESCR characterization, two methods are available which do not require any pre-notch in the specimens. One method is based on strain hardening modulus, measured in the post-yield region from a monotonic tensile test. Results show that value for the strain- hardening modulus bears a direct relationship with ESCR [8,9], and thus can be used to characterize ESCR for PE. The other method is based on creep rate of oriented specimens [10,11], which also shows a directly relationship with ESCR. However, the former method can only compare ESCR in the same aggressive agent, thus not suitable for characterizing ESCR of PE in different aggressive agents. For the latter method, time for fracture is highly sensitive to the loading level and closeness of the loading level to yield strength of the material. Therefore, it is difficult to use the method to compare PEs of different yield strength for their ESCR.
A new concept for ESCR characterization is described in this paper, in which transverse loading is applied to a notch-free specimen. The transverse loading generates cracks first, and with the exposure to an aggressive agent, causes crack growth. The paper will illustrate the concept and present results for two high-density PE (HDPE) and two linear-low-density PE (LLDPE). The results are compared to the values determined from the ASTM D1693 [1], to evaluate the new concept in the time required for the testing.
Test Setup
Figure 1 depicts schematically the test setup for the new concept, which shows that a plate specimen is fixed along the edge and transverse loading is applied to the center of the specimen, using a cylindrical indenter of 50mm in diameter at a speed of 1mm/min. Maximum displacement for the indenter was set at 41mm, selected based on results from a preliminary study in which specimens were not exposed to the Igepal solution, i.e., a water solution of 10% Igepal CO-630 (branched ethoxylated octylphenol) [12]. The displacement of 41mm was selected from a series of tests that applied displacement in the range from 22mm (prior to the yield point) to 48mm (the maximum allowable displacement for the setup). The selected displacement of 41mm is to generate a highly-stretched zone of reasonable size (about 5mm), and is in the displacement range that has a relatively constant loading level so that some difference in the displacement does not affect the loading level applied to the specimens.
Figure 1: Schematic description of set-up for the new test approach.
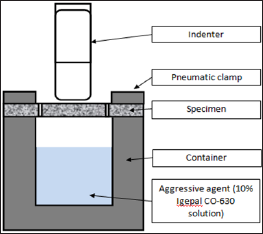
A pneumatic clamp, designed and built in house, was used to hold the specimen during the test, to provide a fixed boundary condition for a circular area of 100mm in diameter. The indentation loading was applied to the center of the circular area during the test. The container housed the Igepal solution, the same aggressive agent recommended in ASTM D1693-A [1] to accelerate the crack development. The assembly of indenter, pneumatic clamp, specimen, and container was placed in an environmental chamber in a universal test machine (QUASAR Q100). All tests were conducted at 50 °C, same as the temperature recommended in ASTM D1693 [1], with one hour preheating before each test. Note that the specimen was not clamped down during the pre-heating stage, to avoid residual stress build-up due to the difference in the thermal expansion between the specimen and the pneumatic clamp.
Two types of high-density PE (HDPE) and two linear-low- density PE (LLDPE) were used in the study. Their ESCR determined using ASTM D1693-A is listed in Table 1. Plaques of the PEs of 6mm thick were prepared by Imperial Oil using compression-molding, and then machined to plate specimens of 100x100mm2. Totally, 24 specimens were used in this study, 5 each for HDPE-B, LLDPE-A and LLDPE-B and 9 for HDPE-A. Majority of the specimens were used to develop the test concept, and to determine the appropriate test conditions (i.e., loading mode and indenter displacement). The final test conditions were used to collect data from two specimens for each type of PE, to ensure the repeatability of the test results and to compare with ESCR listed in Table 1.
Table 1: Materials used in the study.

Concept for the New Approach
The new approach adopts the indentation loading mode, but the loading is to stretch the specimen in the region between the indenter and the pneumatic clamp until local deformation occurs around the indenter, not to compress the area under the indenter. The local deformation bears some similarity to the necking behaviour in a uniaxial tensile test of PE, but with constraint for the width contraction due to the fixed circumferential boundary condition introduced by the pneumatic clamp.
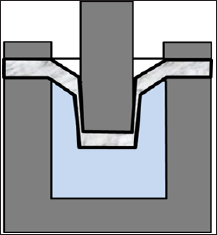
The local deformation transformed the flat specimen into a truncated cone which was dipped into the container that housed the Igepal solution. To avoid pressure build-up in the container due to the specimen deflection, four small holes were introduced evenly along the circumference of the opening area of the specimen, to allow overflow of the Igepal solution to the top surface of the specimen so that both sides of the specimen were exposed to the aggressive agent during the test.
The test consists of two stages. The first stage is to apply monotonic loading to stretch and deflect the specimen into the container. Cracks are initiated in the stretched region before the end of this stage. The second stage is to expose the specimen to the Igepal solution at the fixed deflection, while the load is relaxed with time. Time for the onset of crack growth at the second stage is used to characterize ESCR of PE, as to be detailed later.
Note that creep deformation has also been considered as a possible loading mode for the second stage. However, test results show that under this loading mode, time for crack growth in the stretched region depends on both the stress level and closeness of the stress level to the yield strength of PE, consistent with results reported before [13]. Since PEs used in this study have different degrees of crystallinity, thus different mechanical properties [14], it is difficult to select a common creep loading level for all PEs to generate ESC in a reasonable time frame. On the other hand, as to be shown later, deflection for yielding is similar among the four types of PE. Therefore, load relaxation after the yield point was chosen as the loading mode for the second stage of the test.
Figure 2 presents the sectional view of specimen deformation introduced at the first stage of the test, which depicts the transformation ofthe specimen shape from a flat plate to a truncated cone. Since the indenter prevents radial contraction of the truncated cone, a biaxial stress state is generated around the surface of the truncated cone, resulting in crack formation in this region. Growth of the cracks to the neighboring low-strain region is accelerated by the exposure to the Igepal solution at the second stage, and time for the crack growth at this stage is used to characterize ESCR for the specimen. As cracks can be generated at the first stage of the test, the specimen does not require any pre-notch, thus simplifying the specimen preparation procedure.
Figure 2: Transformation of a plate specimen to a truncated cone.
Results
Figure 3 presents a typical load-displacement curve generated from the first stage of the test. The curve can be divided into three parts. Part 1, on the left, shows a concave-upward profile which is for the initial contact of the indenter with the specimen; part 2, in the middle, is from the stretch of the truncated cone; part 3, on the right, is also from the stretch of the truncated cone, but after yielding that starts from the region in contact with the circumference of the indenter. As shown in Part 3 of the curve, load continues to increase with the increase of displacement after the yielding has started. This is caused by increase of the circumference of the yielded zone, due to growth of the local deformation towards the boundary that is set by the pneumatic clamp.
Figure 3: Typical load-displacement curve from the first stage of the test.
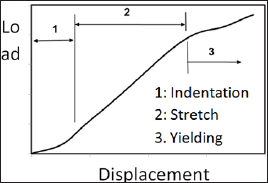
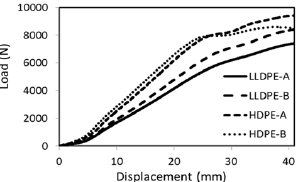
Figure 4 summarizes the typical load-displacement curves from the first stage of the test, for all four PEs used in this study. In general, HDPE specimens have a higher stiffness and yielding load than the LLDPE specimens. However, the yielding displacements are similar, all in the vicinity of 27mm. Figure 4 also shows that HDPE-B specimen has reached its maximum load-carrying capacity before the end of the first stage. On the other hand, load for HDPE-A, LLDPE-A and LLDPE-B increases continuously at the end of the first stage.
Figure 4: Summary of load-displacement curves from the first stage of the test.
Since the specimens can be in contact with the Igepal solution at the first stage of the test, thus potentially weakening the cracking resistance, influence of such a contact at the first stage on the loaddisplacement curve has been investigated by comparing the curves in Figure 4 with curves generated under the same loading condition but without any contact with the Igepal solution. The comparison is presented in Figure 5 in which the curves labelled "wet" are from specimens in contact with the Igepal solution (same curves as those in Figure 4) and "dry" without. Figure 5 suggests that apart from HDPE-B, contact with the Igepal solution has little effect on the load-displacement curve. This is partly because the container was not filled up with the Igepal solution, as shown in Figure 1. Rather, the Igepal solution was filled only to a level about 20mm below the specimen. Therefore, contact of the specimens with the Igepal solution was only during the second half of the first stage, of around 20 minutes.
It should be noted that for HDPE-B, Figure 5, the dry curve continued to increase at the end of the first stage, while the wet curve started decreasing already. This suggests that the load drop in the wet curve for HDPE-B was due to the contact with the Igepal solution. This is consistent with the ESCR values shown in Table 1 in which ESCR for HDPE-B is much lower than that for the other PEs.
Figure 5: Load-displacement curves from the first stage of the test: (a) LLDPE-A, (b) LLDPE-B, (c) HDPE-A, and (d) HDPE-B. Solid line is from specimen in contact with the Igepal solution (wet), and dashed line without (dry).
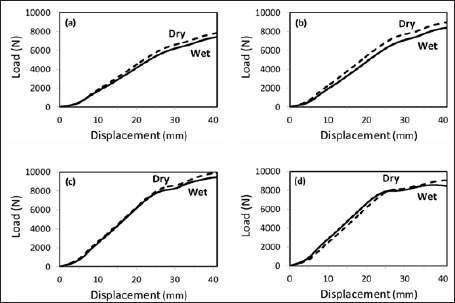
Figure 6 presents typical load-time curves from the second stage of the test, with load expressed in terms of the fraction of the load at the end of the first stage and time in the logarithmic scale. Similar to Figure 5, the curves labelled "dry" in Figure 6 are from the tests without the specimen being exposed to the Igepal solution, and those "wet" with. Figure 6 shows clearly that the exposure to the Igepal solution in the second stage has accelerated the load drop and changed the load drop trend. Critical time for the change of the load drop trend can be determined from Figure 6 based on intersection of two lines, each being the extension of the relatively straight section of the curve before or after the critical point.
Figure 6: Normalized load versus logarithmic scale of time at the second stage of the test: (a) LLDPE-A, (b) LLDPE-B, (c) HDPE-A, and (d) HDPE-B.
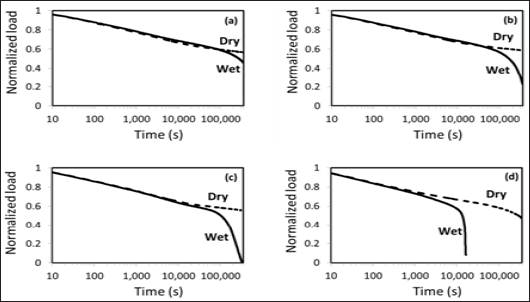
Figure 7 presents photographs of typical specimens after the tests. Figure 7a is from a dry test of HDPE-A, i.e. without contact with the Igepal solution, and is a representative curve for all PEs in the dry condition. Plastic zone, as indicated by an arrow in Figure 7a, was developed at the first stage of the test, in which vertical cracks are visible. Growth of the vertical cracks in the wet condition caused change of the load drop trend. Critical time for the change of the load drop trend in the second stage is used to characterize ESCR in the proposed new test concept. In the dry condition, on the other hand, the vertical cracks do not grow to the neighboring low-strain region.
Figure 7: Typical specimens after the test: (a) dry HDPE-A, (b) wet LLDPE-A, (c) wet LLDPE-B, (d) wet HDPE-A, and (e) wet HDPE-B.
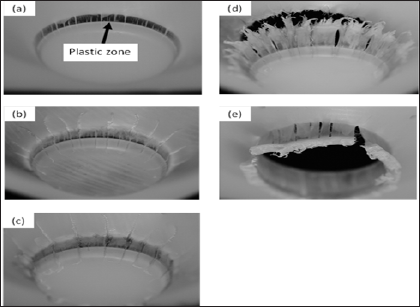
Since the vertical cracks, as shown in Figure 7a, can be developed at the first stage, specimens for the new test approach do not require any pre-notch before the test, thus reducing the data scattering that might be caused by quality inconsistency of the prenotches.
Figure 7b-7e present typical post-tested specimens in the wet condition. All figures show the growth of the vertical cracks into the neighboring low-strain region. Compared to Figure 7a, growth of the vertical cracks must have occurred at the second stage, due to the exposure to the Igepal solution. Figure 7b &7c, from LLDPE-A and LLDPE-B, respectively, suggest that even with the crack growth, the specimens maintain the integrity after four days in the Igepal solution. Figure 7d, from HDPE-A, indicates that growth of the vertical crack has resulted in the formation of a circular crack that separates the truncated cone from the remaining part of the specimen. For HDPE-B, Figure 7e, the circular crack was formed along the circumference in contact with the indenter. This was possibly due to the commencement of crack growth before the end of the first stage, as indicated by the load drop in the wet curve of Figure 5d.
Figure 8: Summary of the critical time for the change in the load drop trend in the wet curves of Figure 6, plotted against the time from ESCR-A (10%) in Table 1.
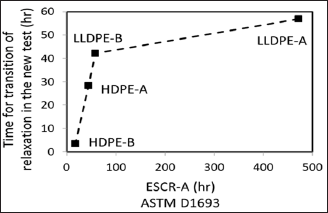
Critical time for change in the load drop trend of the wet curves in Figure 6 is summarized in Figure 8, plotted against the ESCR values listed in Table 1. Figure 8 suggests that time to initiate crack growth using ASTM D1693-A is longer than that from the new test approach. The difference is biggest for LLDPE-A in which time for crack growth using the ASTM D1693-A is about 8 times of that using the new test approach, even though thickness of specimens used in the current study is 10mm while that for ASTM D1693-A is 3mm. If specimen thickness is reduced from 10 to 3mm, time for crack growth using the new test approach is expected to be even shorter than that shown in Figure 8.
Conclusions and Future Work
A study was conducted to develop a new test concept for evaluating ESCR for PE. It has been found that transverse indentation on a plate specimen can be used for this purpose. The transverse loading generates a localized plastic zone in which cracks are formed due to the constraint for the width contraction. Growth of the cracks into the neighboring low-strain region causes a change in the load drop trend during the load relaxation stage. The study has found that time for the change in the load drop trend can be used to characterize ESCR for PE, which has been confirmed to be shorter than that from the standard method, even though specimens used in this study are much thicker than those for ASTM D1693-A [1].
In spite of the above advantages, the following issues remain to be resolved before the new concept becomes practical for the ESCR evaluation. The first issue is the size of the specimens. Further study is needed to reduce specimen size so that the specimen can be taken directly from PE products when testing such a sample is required. Secondly, using the change in the load drop trend to characterize ESCR requires the load drop data to be recorded for a period much longer than the critical time for the change of the load drop trend. In order to reduce the time for the testing, possibility of using other means to detect the crack growth, instead of recording the load drop, will be explored in the future study.
Acknowledgements
The work was sponsored by Imperial Oil, under the program University Research Awards. Sincere appreciation is due to technical staff in the Department of Mechanical Engineering at the University of Alberta, including Marchand, Campbell, Mooney, Hilvo and Waege, for the assistance in the specimen preparation and test setup. Appreciation is also due to Woolston and Cooke in ExxonMobil Chemical Canada for the supply of the PE plaques and Nguyen at the University of Alberta for the assistance in the preliminary testing.
References
- American Society for Testing and Materials (ASTM) D1693 (2012) Standard test method for environmental stress-cracking of ethylene plastics.
- Lustiger A (1998) Understanding environmental stress cracking in polyethylene. In: Medical plastics: degradation, resistance & failure analysis, Portnoy RC (Ed.), SPE, Plastic Design Library, 66-71.
- Wright DC (1996) Environmental stress cracking of plastics. Smithers Rapra Technology Ltd., Shawbury, UK.
- Kramer EJ (1979) Developments in polymer fracture. In: Andrews EH (Ed.), Applied Science Publishers, London, England, 1: 3.
- International Standard (ISO) 22088-2 (2006) Plastics - Determination of resistance to environmental stress cracking (ESC), Part 2: Constant tensile load method - Method A.
- Lustiger A (1986) Failure of Plastics. Hanser, Munich, Germany
- Scheirs J (2000) Compositional and failure analysis of polymers: A practical approach, Wiley, Chichester, pp 556-561.
- Kurelec L, Teeuwen M, Schoffeleers H, Deblieck R (2005) Strain hardening modulus as a measure of environmental stress crack resistance of high density polyethylene. Polymer 46(17):6369-6379.
- Cheng J, Polak M, Penlidis A (2009) A tensile strain hardening test indicator of environmental stress cracking resistance. J Macromol Sci Pure and Applied Chemistry 45(8): 599-611.
- Cawood MJ, Channell AD, Capaccio G (1993) Crack initiation and fibre creep in polyethylene. Polymer 34(2): 423-425.
- Rose LJ, Channell AD, Frye CJ, Capaccio G (1994) Slow crack growth in polyethylene: a novel predictive model based on the creep of craze fibrils. J Appl Polym Sci 54(13): 2119-2124.
- Hertzberg RW (1989) Deformation and fracture mechanics of engineering materials, Wiley, New York, USA.
- McNally D (2003) Encyclopedia of polymer science and technology. In: Mark HF (Ed.), (3rd edn), Wiley, Hoboken, NJ, USA 2: 489.
- Nielsen, Lawrence E (1954) Effect of crystallinity on the dynamic mechanical properties of polyethylenes. J Appl Phys 25: 1209-1212.
© 2018 PY Ben Jar. This is an open access article distributed under the terms of the Creative Commons Attribution License , which permits unrestricted use, distribution, and build upon your work non-commercially.
 a Creative Commons Attribution 4.0 International License. Based on a work at www.crimsonpublishers.com.
Best viewed in


.jpg)


 Editorial Board Registrations
 Submit your Article
 Refer a Friend
 Advertise With Us
.jpg)


.jpg)


.bmp)
.jpg)
.png)
.jpg)


.png)

.png)


.png)


