- Submissions

Full Text
Progress in Petrochemical Science
Effect of Excess Iron on Oxidative Dehydrogenation of 1-Butene over a Series of Zinc Ferrite Catalysts
Cory Black1, Ron R Spence1, Keith Whiston2, Stephen Sproules1 and S David Jackson1*
1 Centre for Catalysis Research, University of Glasgow, UK
2 Invista Textiles (UK) Ltd., the Wilton Centre, UK
*Corresponding author:S David Jackson, Centre for Catalysis Research, School of Chemistry, University of Glasgow, Glasgow G12 8QQ, UK
Submission: May 11, 2018;Published: June 13, 2018

ISSN 2637-8035Volume2 Issue2
Abstract
The influence of excess Fe3+ in ZnFe2 O4 for the catalytic oxidative dehydrogenation of 1-butene to 1, 3-butadiene was investigated to try to clarifyinconsistencies in the existing literature. A series of nanoscale zinc ferrite powders were produced with increasing Fe: Zn ratios. The materials werecharacterized by a range of techniques, which showed the presence of α-Fe2 O3 as a distinct phase with an increasing excess of Fe3+ and SEM highlightedthe increased presence of surface structures on the ferrites at higher Fe: Zn ratios. Reaction testing showed α-Fe2O3to be virtually inactive for theoxidative dehydrogenation of 1-butene. Results for the ferrite catalysts showed a significant decrease in both conversion and yield with an increasing excess of Fe3+. Therefore an excess of Fe3+ has a negative effect on catalytic activity and selectivity of zinc ferrite for the oxidative dehydrogenation of1-butene, but acts as a promoter for competing hydrogenation and combustion side reactions.
Keywords: Zinc ferrite; Oxidative dehydrogenation; Butene; 1.3-butadiene; Iron
Introduction
Armstrong & Miller [1] discovered 1,3-butadiene in 1886 as a product of his high temperature treatment of petroleum [1], since then 1,3-butadiene has been used for the production of a wide variety of synthetic rubbers and elastomers, in particular styrene-butadiene rubber and polybutadienes, which make up approximately 54% of the global 1,3-butadiene demand [2]. Butadiene is also used as a raw material in the production of hexamethylene diamine, which is used for Nylon-6, 6 manufactures. Currently, 1, 3-butadiene is almost solely produced from crude oil as a by-product of the steam cracking of naphtha and higher crude oil fractions for the production of ethylene. In recent years the demand for 1,3-butadiene products has been steadily rising and is expected to reach approximately USD 33.01 billion by 2020 [3]. Butadiene yields from steam cracking vary widely with the composition of the refinery feed and are significantly lower for light hydrocarbon feeds derived from shale gas, because of this there is uncertainty about future 1,3-butadiene supply and therefore pricing has driven a considerable amount of interest in alternative methods for producing it by on-purpose through chemical catalysis. Although a variety of other processes have been investigated for the on-purpose production of 1,3-butadiene, such as the Lebedev reaction from ethanol and dehydration routes from butanediols [4], routes employing dehydrogenation of alternative hydrocarbon feeds are the most highly developed. Oxidative dehydrogenation (ODH) of 1-butene has been shown to be a promising alternative method for 1,3-butadiene production [5,6] and has been practised commercially when economically viable to do so.
A significant body of research exists examining 1-butene ODH over a wide variety of spinel ferrite catalysts [5,7-11] and of the spinel ferrites tested for 1-butene ODH, it has been shown that zinc ferrite is the best catalyst, with 1,3-butadiene selectivity of ~95 % and butane conversion of ~70% [8]. However other systems have also been tested such as ones based on bismuth and molybdenum. Quite often these systems are modified by other elements, e.g. the addition of nickel to a BiFe0.65Mo oxide catalyst [12] but in general these catalysts give a higher selectivity to carbon dioxide than is found with the ferrites. A review of the use of bismuth and ferrite catalysts for 1-butene conversion to 1, 3-butadiene has been published [13]. Iron oxide as Fe2O3 has also been used for 1-butene conversion but using carbon dioxide as the oxidant [14]. This catalyst system though does not compare well with the ferrite system. The selectivity to 1, 3-butadiene is low (~25%) and a higher temperature is needed (~823K c.f. 743K) making this an uneconomical prospect compared to either the Bi/Mo or ferrite systems.
The spinel term defines a structure with the formula AB2O4 where A is a divalent cat-ion, A2+, and B is a trivalent cat-ion, B3+. There are three types of spinel structure: normal, inverse and random. In a normal spinel the oxygen ions in the structure are arranged in a face centred cubic close packed lattice with A2+ filling 1 in every 8 tetrahedral holes and B3+ in half of the octahedral holes. In an inverse spinel structure B3+ cat-ions would occupy tetrahedral holes with a 1:1 mixture of A2+ and B3+ cat-ions occupying the octahedral holes. Between these two extremes of the spinel structure is the random spinel where A2+ and B3+ cat-ions are distributed randomly between octahedral and tetrahedral holes [15]. Zinc ferrite is known to exist as a normal spinel, where the Zn2+ represents the A ions and Fe3+ represents the B ions, however recent literature has shown that at small particle sizes (< 100nm) there is a degree of inverse spinel character to zinc ferrite, which increases as the particle size gets smaller [16,17].
As 1, 3-butadiene is such a useful and valuable resource, a significant amount of research has been carried out looking at improving zinc ferrite catalyst activity for the ODH of 1-butene. The research has covered a wide variety of different synthesis methods and potential zinc ferrite promoters; including sulphur [6], aluminium [7], phosphoric acid [18], and α/γ-Fe2O3 [19,20]. In a study examining a series of biphasic ZnFe2O4/α-Fe2O3 catalysts, the biphasic catalyst exhibited a considerably higher conversion than pure ZnFe2O4or α-Fe2O3 with a maximum conversion of 82.2% for a 35.3% α-Fe2O3/ZnFe2O4catalyst, whilst also showing a high 1,3-butadiene selectivity, 92.6% [19]. Results also showed that the catalytic activity of the biphasic catalysts was almost entirely independent of the wt.% α-Fe2O3 present, indicating that the catalytic activity of the catalyst was due to a synergistic effect between the two phases and not as a result of the phases working independently. It was suggested that the synergistic effect may be the result of a role distribution whereby ZnFe2O4 activated 1-butene and α-Fe2O3 activated the gas-phase oxygen, which then spilled over onto the ZnFe2O4 surface, where the ODH reaction occurred. A patent filed by Miao et al. [21] in 2004 also revealed very good catalytic activity for a Zn2.5AlMgFe10O20.Z (α-Fe2O3) catalyst used in 1-butene ODH reactions, where Z is the percentage by weight of α-Fe2O3 present. In a catalyst with a Z value of 54.3%, a 1, 3-butadiene selectivity and conversion of 91.3% and 85.9% were recorded respectively.
In contrast to these works showing α-Fe2O3 as a 1-butene ODH promoter, Armendáriz et al. [22] carried out work looking at the effect of altering a ZnFe2O4 catalyst stoichiometry for the oxidative dehydrogenation of n-butane [22]. They showed that by modifying the stoichiometry of their catalyst they could tune the product selectivity of the reaction. They found that the presence of α-Fe2O3 phase alongside the ZnFe2O4 phase led to a high selectivity towards CO2, ~73%. They attributed this effect to increased oxygen lattice reactivity shown by TPR results. A study by Young-Min et al. [23] also produced a zinc ferrite catalyst with α-Fe2O3 present as a distinct phase and noted that the presence of this additional phase reduced catalytic activity of the zinc ferrite as an oxidative dehydrogenation catalyst. This work set out to determine whether the addition of excess Fe to ZnFe2O4 improves or impairs catalytic activity for the ODH of 1-butene to 1,3-butadiene. To tackle this, a series of zinc ferrites with the chemical formula Zn1-xFe2+xO4 (x=0, 0.1, 0.2, 0.3, 0.4, 0.5) were produced by a co-precipitation method. An in depth study of the catalysts was conducted, including full characterisation of the catalyst pre- and post-reaction and the reaction chemistry.
Experimental
Catalyst preparation
All catalysts were produced by a co-precipitation methodology. FeCl3.6H2O (>98 %, Alfa Aesar) and ZnCl2 (97 %, Alfa Aesar) were dissolved separately, in stoichiometric proportions, in deionised water. The two metal precursor solutions were then added simultaneously into a rapidly stirring 3M NaOH (98-100 %, Sigma- Aldrich) solution. The resultant precipitate mixture (~pH 11) was then left to stir overnight before being washed to pH neutral through a series of washing and centrifugation steps. The precipitate was dried at 448K for 16h, crushed and sieved to produce a size of between 250-450μm and calcined at 748K for 4h.
Catalyst characterization
Atomic absorption analysis was obtained using a Perkin Elmer Analyst 400 Atomic Absorption Spectrophotometer with Winlab32 software. An accurately weighed sample of catalyst was dissolved in aqua regia for 30min at 393K and the resulting mixture diluted 1:1000 with deionised water before analysis. X-ray Photoelectron Spectroscopy (XPS) was performedat the National EPSRC XPS Users’ Service (NEXUS) at Newcastle University, an EPSRC Mid- Range Facility. Measurements were performed on a Thermo Scientific Theta Probe, with a Micro focused monochromatic AlKαv source. Data were acquired with pass energy of 40eV and data analysis was performed using Casa XPS software. Surface area measurements were conducted on a Micrometrics Gemini II 2375 Surface Area Analyser. Catalyst (0.03-0.05g) was accurately weighed, added to a glass sample tube and degassed in nitrogen overnight at a temperature of 383K. The sample was then reweighed and the measurement was taken. The surface area was calculated using the Brunauer, Emmett and Teller (BET) adsorption isotherm equation. Ambient temperature Raman spectroscopy was run on a Horiba Lab RAM HR spectrophotometer. The spectra were collected on a 150mW 562nm green laser from 100 to 1500cm-1. Ambient temperature XRD patterns were obtained using an XPert Pro X-Ray Diffractometer fitted with a reflection/transmission spinning flat plate. The analysis was carried out with a step size of 0.02° and a scan rate of 30s per step from 5-85 2θ. X-band EPR spectra were, measured using a Bruker ELEXSYS E500 spectrometer. The zinc ferrite samples were diluted 0.5% in zinc oxide using a ball mill to achieve a homogeneous powder. Thermo gravimetric analysis was performed on a SDT Q600 series combined TGA/DSC instrument with an online ESS Evolution Mass Spectrometer. For temperature programmed oxidation (TPO) and temperature programmed reduction (TPR) , catalyst samples (approximately 0.005g) were heated from ambient to 1000 °C at a ramp rate of 10 °C min-1 under a 2% oxygen balance argon mixture (TPO) or a 5% hydrogen balance nitrogen mixture (TPR) at a flow rate of 100cm3 min-1, whilst mass spectrometry data was collected simultaneously.
Catalyst testing
The catalysts produced were tested for 1-butene ODH in a continuous-flow fixed-bed reactor at ambient pressure. The reactor tube was packed with fused alumina chips with a 1cm3 catalyst bed in the centre. Experiments with only the fused alumina showed no conversion. The catalyst was heated to 743K under a flow of 20% O2/Ar (37.5cm3min-1) and held at temperature for 1h. The reactor was then cooled to 693K and flows of 1-butene (10cm3min-1) and steam (150cm3min-1) were introduced. The steam was produced by pumping an appropriate flow of water with an HPLC pump through a vaporiser. The molar ratio of components in the ODH gas feed was 0.75:1:15 oxygen: 1-butene: steam with an overall GHSV of 10,050hr-1. The reaction was run for approximately 90h. The eluant from the reactor tube in gaseous form entered a knockout pot where water was condensed. Gaseous samples were subsequently analysed by on-line gas chromatography using a Thermo Scientific Focus Gas Chromatograph equipped with a Flame Ionisation Detector and a Chrompack sodium sulphate on alumina column. GC analysis of the water confirmed only trace levels of dissolved hydrocarbons. The absence of carbon dioxide (< 0.5% yield) was confirmed by gas chromatography (TCD) and mass spectrometry.
Selectivity and conversion were calculated as outlined in Equation 1 and Equation 2.
Equation 1 - Equation for calculation of conversion.
figure:

This analysis allows for a measure of isomerisation as well as direct oxidative dehydrogenation.
Equation 2 - Equation for calculation of selectivity of product X.
figure :

Yield of a product (Y) was calculated by Y = C*S.
Results
Results are structured to present characterization of the asprepared catalysts, looking at both structural and electronic changes, with increased Fe: Zn ratio. This is followed by a comprehensive analysis of the reaction chemistry and characterization of the postreaction catalysts.
Pre reaction catalyst characterization
Atomic absorption: Table 1 shows results from atomic absorption spectroscopy performed on the catalyst series. For absorption measurements and compared to its designated target ratio. In all cases the measured ratio was within 10% of the target, however it can be seen that the correlation between the target and measured ratio is better for the lower Fe: Zn ratio catalyst, suggesting that the excess iron in the catalyst preparation method may affect the co-precipitation at the higher ratios.
Table 1: Atomic absorption results for ferrite catalysts.

XPS analysis: Table 2 details results obtained by XPS, showing the relative percentages of each ion, from which a Fe: Zn ratio was calculated. Results show a measured Fe: Zn ratio of 5.0 and 9.0 for the ZnFe2O4 and Zn0.5Fe2.5O4 respectively. For both catalysts tested the measured Fe: Zn ratio was far higher than the target one, an indication of excess Fe on the catalyst surface. Atom percentages for Fe3+, Zn2+ and O2- were also calculated, for both the 2.0Fe and 2.5Fe catalysts the percentage of O2- at the surface remains relatively constant at ~71%, however there is a significant decrease in the presence of Zn2+ at the surface of the catalyst as the Fe: Zn ratio of the catalyst is increased and consequently an increase in surface Fe3+.
Table 2: XPS results for ZnFe2O4 and Zn0.5Fe2.5O4 pre- and post-reaction.

BET surface area: Table 3 shows results from BET surface area measurements, a significant increase in surface area from 36m2.g- 1 to 71m2.g-1 was observed on increasing the catalyst Fe: Zn ratio from 2:1 to 2.3:1. As the Fe: Zn ratio was further increased the surface area began to decrease with the highest Fe: Zn ratio catalyst, Zn0.5Fe2.5O4, having a surface area of 46m2.g-1. An overall increase in average pore diameter was measured with increased Fe: Zn ratio, with a maximum of 182Å for Zn0.5Fe2.5O4, however total pore volume did not change significantly with increased Fe: Zn ratio.
Table 3: BET surface area measurements for pre- and post-reaction ferrite catalysts.
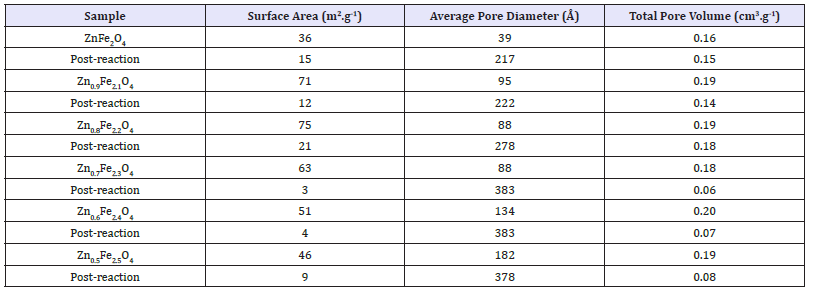
figure 1:Comparison of Raman spectra for zinc ferrite and iron oxide catalysts.
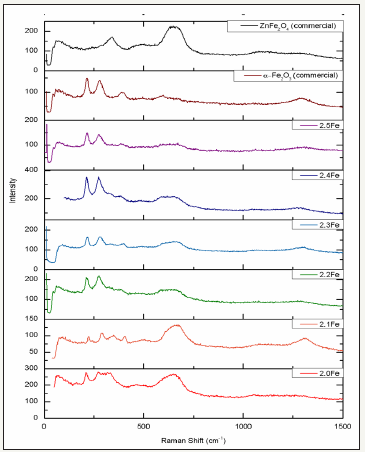
Raman spectroscopy: ZnFe2O4 is a member of the space group Fd3m and has five first-order Raman active modes, Eg, A1g, F2g (1), F2g (2) and F2g (3) [24]. Figure 1 and Table 4 show the Raman spectra and band assignments for the altered Zn/Fe ratio catalyst series. It can be seen that the Raman spectra for all of the zinc ferrites produced match up well with both the commercial zinc ferrite sample and examples from the literature [24], indicating that the zinc ferrite phase was successfully produced in all cases. It can be observed however that there are two additional peaks present in the synthesised zinc ferrites, which are not present in the commercial zinc ferrite sample, ~210cm-1 and 275cm-1. Although bands at ~221cm-1 and 246cm-1 are observed in some literature studies looking at the zinc ferrite Raman spectra [24], they are generally of very low intensity and are often not seen at all [25] whereas those observed as part of this work are much more intense and appear to become more intense compared to the remaining zinc ferrite bands, as Fe/Zn ratio is increased. Upon visual inspection of the Raman spectra presented in Figure 1 it is clear that the intense bands observed at ~210cm-1 and 275cm-1 in the synthesised zinc ferrites are also present in the spectra for α-Fe2O3. It is therefore hypothesised that α-Fe2O3 is present in all of the zinc ferrite samples synthesised and that if the F2g (1) and Eg zinc ferrite modes are present in the spectra, that they are being masked by the much more intense A1g and Eg bands of α-Fe2O3 [26]. The remaining α-Fe2O3 modes are all much less intense and fall at similar Raman shifts to those of zinc ferrite; it would therefore be difficult to distinguish them. Work by Lin et al [27] attributed the broad low intensity peaks at ~1000 - 1400cm-1 to a scattering. Which arises from the interaction of two magnons in close proximity which have occurred on anti parallel spin sites.
Table 4: Raman band assignments for ferrite catalysts.

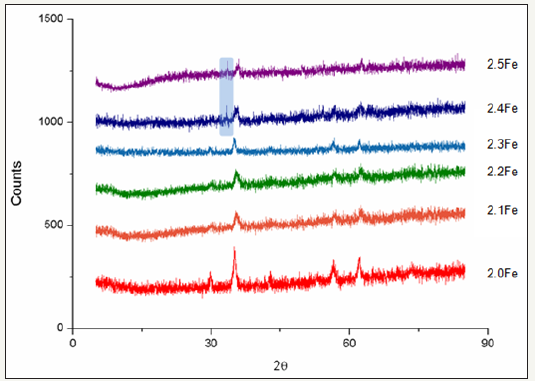
X-Ray diffraction: X-ray diffraction patterns for the zinc ferrite catalysts are shown in Figure 2. All catalysts showed the characteristic reflections of the zinc ferrite spinel structure. A significant amorphous background was present for all catalysts, which increased relative to the main reflections with increased Fe: Zn ratio. In the two highest Fe: Zn ratio catalysts, 2.4Fe and 2.5Fe, there is an additional peak at ~33° (highlighted in blue) which does not correspond to zinc ferrite, however it does correlate to a reflection found in the x-ray diffraction pattern for α-Fe2O3, indicating the presence of α-Fe2O3 at higher Fe: Zn ratios. The presence of an α-Fe2O3 phase being produced alongside the ZnFe2O4 phase is documented in other studies [28,29]. The commercial zinc ferrite sample gave an XRD pattern identical to that for the sample with a Fe: Zn ratio of 2.0.
figure 2:Comparison of X-ray diffraction patterns of zinc ferrite catalysts.
EPR Spectroscopy: Electron paramagnetic resonance spectroscopy was performed on the zinc ferrite catalysts to look for changes to the electronic structure. The as-prepared catalysts displayed near-identical EPR spectra of an isotropic signal with a Lorentzian lineshape (Figure 3). The signal is characterized by the g-factor, the field-to-frequency ratio defined as g=hν/μBB, where h is Planck’s constant, ν the microwave frequency (X-band, ~9.8GHz), μB is the Bohr magneton, and B the magnetic field. For extended solids such as zinc ferrite, the resonant field position-the crossing point in these derivative spectra-is not exclusively a function of the interaction of unpaired electrons with the magnetic field-the Zeeman interaction-but has contributions from the many spin-spin interactions within the material [30]. In this situation, the resonant field position is denoted by an effective g-value, geff, for the material, which is not wholly diagnostic of the electronic structure. More useful in the analysis of ternary oxides is the line width, which is defined as the distance between the positive and negative peaks of the derivative spectrum, Bpp, in units of magnetic field (mT). Here, there is small albeit significant trend in Bpp for the prereaction catalysts, with line width of 19mT for 2.0Fe compared to 26mT for 2.5Fe. This trend is not incremental across the series and due to the small variations in packing of the quartz tube and in homogeneity from the sample dilution.
figure 3:Overlay of the X-band EPR spectra for pre- and post-reaction ferrite catalysts normalised to the peak height of the derivative.
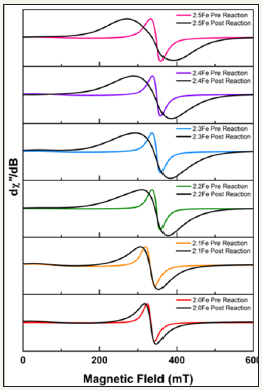
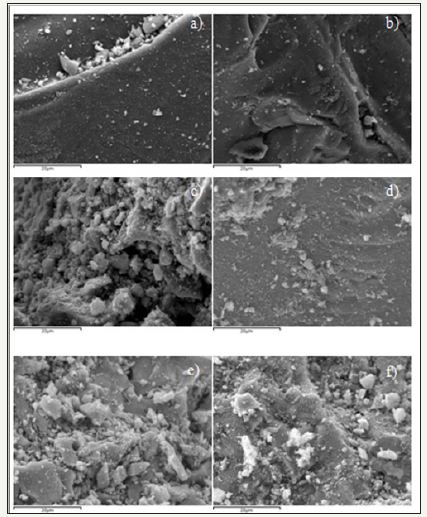
figure 4:SEM images of ferrite catalysts a)ZnFe2O4 b)Zn0.9Fe2.1O4 c)Zn0.8 Fe2.2O4 d)Zn0.7Fe2.3O4 e)Zn0.6Fe2.4O4 f) Zn0.5Fe2.5O4.
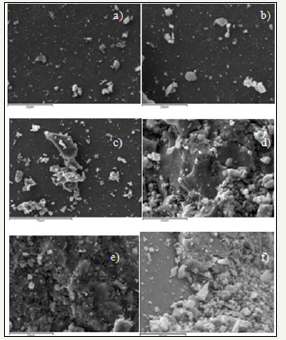
SEM imaging: SEM images of the fresh catalysts Figure 4 shows the presence of a number of surface structures on each of the ferrites. These structures are of irregular shape and size but all appear to be < 10μm in diameter. As the Fe: Zn ratio of the catalyst was increased there was an increase in the presence of these structures. There also appears to be a change in the texture of the catalyst surface itself, which is quite smooth and featureless in the stoichiometric catalyst but becomes more rough and uneven as the Fe: Zn ratio is increased
figure 5:Overlay of the X-band EPR spectra for pre- and post-reaction ferrite catalysts normalised to the peak height of the derivative.
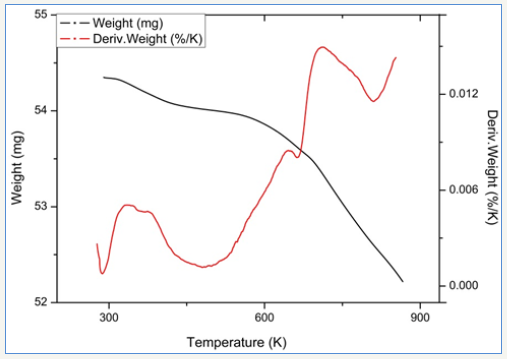
figure 6:TPR profile of 2.5Fe catalyst.
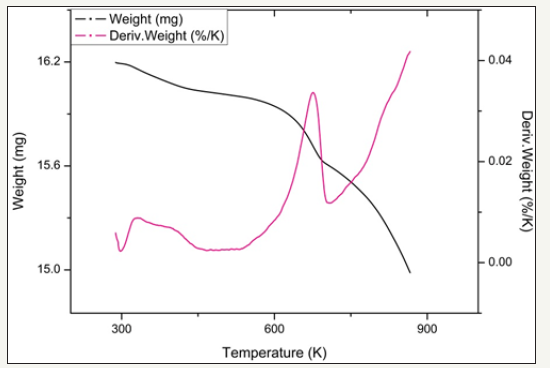
Temperature programmed reduction : Figures 5 and 6 show the TPR the TPR profiles obtained for catalysts 2.0Fe and 2.5Fe, TPR profiles for the remaining catalysts (2.1Fe, 2.2Fe, 2.2Fe and 2.3Fe) are available in the Supplementary Information. Catalysts 2.0Fe and 2.1Fe showed 3 distinct phases of weight loss at ~370K, ~670K and ~685K. The weight loss at ~370K was attributed to loss of adsorbed water from the catalyst surface, this was confirmed by mass spectrometry data collected during the reduction. The remaining two weight losses were attributed to reduction of Fe3+ to Fe 2+ Catalysts 2.2Fe, 2.3Fe, 2.4Fe and 2.5Fe also showed loss of adsorbed water at ~370K and a further weight loss event at ~670K, however there is no evidence of the third weight loss event at ~685K.
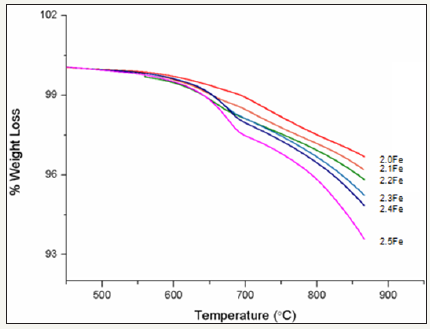
Figure 7 shows the percentage weight loss, for each of the zinc ferrite catalysts, with increasing temperature. The graph has been normalised so as to exclude any weight loss before 450K as this was attributed to loss of physisorbed water and is not related to reduction of the ferrite itself. It can be seen that overall percentage weught loss increases with increased Fe:Zn ratio, with catalyst 2.5Fe showing the highest weight loss by the end of the experiment, ~6%.
figure 7:Percentage weight loss with temperature for zinc ferrite catalysts.
Oxidative Dehydrogenation of 1-Butene over Metal Ferrites: Figure 8 shows the 1-butene conversion throughout the oxidative dehydrogenation reactions for the zinc ferrite catalysts tested. With the exception of 2.4Fe, a decrease in conversion, over the course of the reaction, was observed for all catalysts tested. Conversion was shown to decrease with increasing catalyst Fe: Zn ratio, with catalysts Zn0.5Fe2.5O4 performing the worst and the stoichiometric zinc ferrite performing best. Table 5 shows the deactivation constants, kd, calculated for each of the zinc ferrite catalysts tested for 1-butene ODH. The highest kd was calculated for the catalyst 2.1Fe and the lowest was for catalyst 2.4Fe, however no direct correlation was observed between kd and increased Fe: Zn ratio.
Table 5: Deactivation constants for ODH of 1-butene over zinc ferrites.
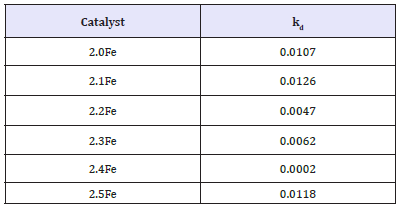
figure 8:1-Butene conversion as a function of time on stream for 1-butene ODH over zinc ferrite catalysts (limited number of points shown for clarity).
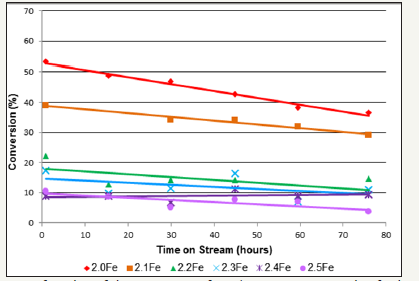
1, 3-Butadiene was the major reaction product for each of the catalysts tested although the catalysts also were active for butene isomerisation. Figure 9 clearly shows that upon increasing the Fe: Zn ratio of the catalyst, above that of the stoichiometric catalyst, there was a notable decrease in 1, 3-butadiene yield. Table 6 shows the 1, 3-butadiene selectivity’s observed for each catalyst at 30 and 75h. The results show a selectivity of 98.9% for the stoichiometric zinc ferrite after 30h, which was virtually the same after 75h. Selectivity after 30h was shown to decrease with increasing Fe: Zn ratio, with catalyst 2.4Fe showing the lowest selectivity (48.7%) after 30h. It can also be observed that in all of the catalysts with an Fe: Zn ratio above that of the stoichiometric catalyst there was a significant decrease in selectivity between the 30 and 75 hour samples. This decrease in selectivity was most pronounced in the 2.5Fe catalyst where selectivity after 75h was only 17.3%.
figure 9:1, 3-Butadiene yield as a function of time on stream for 1-butene ODH over zinc ferrite catalysts (limited number of points shown for clarity).
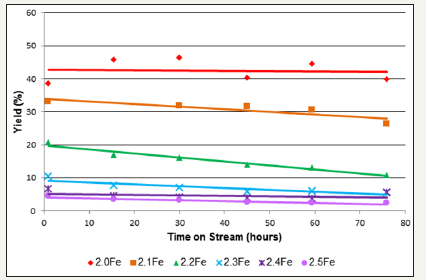
Table 6:1, 3-Butadiene selectivity for 1-butene ODH over zinc ferrite catalysts at 30 and 75h.

figure 10:Butane yield as a function of time on stream for 1-butene ODH over zinc ferrite catalysts (limited number of points shown for clarity).
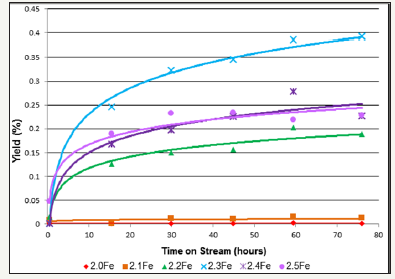
When the oxidative dehydrogenation of 1-butene was carried out over the stoichiometric catalyst, 2.0Fe, the yield of butane was less than 0.001% and selectivity less than 0.1% making butane a minor reaction product. However as the Fe: Zn ratio of the zinc ferrites was increased there was a marked increase in butane yield and selectivity (Figure 10 and Table 7). The ferrite with the highest Fe: Zn ratio, Zn0.5Fe2.5O4, showed the highest butane selectivity and yield, ~9% and ~0.4% respectively, after 75h. Butane yield is shown to increase with time on stream for all of the catalysts tested, Figure 10.
Table 7:Butane selectivities for 1-butene ODH over zinc ferrite catalysts at 30 and 75h.

figure 11:B1, 3-Butadiene (1, 3-BD) and carbon dioxide yield as a function of time on stream for 1-butene ODH over an α/γ Fe2O3 catalyst [22].
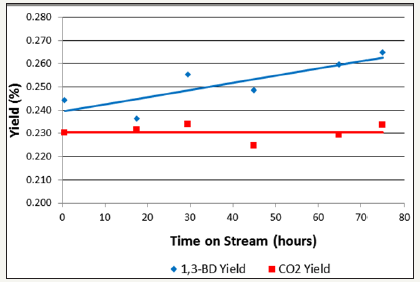
Some isomerisation to produce cis- and trans-2-butene was observed in each reaction. Typically less than 10% of the 1-butene reactant feed was isomerised to cis- and trans-2-butene at any given point during the time on stream. As well as the main reaction products described above, there were also a variety of minor reaction products produced by isomerisation reactions and cracking namely isobutene, propane, ethane and methane, each with a selectivity of < 1% over the stoichiometric zinc ferrite catalyst. Methane, ethane and propane all showed minor increases in selectivity as the Fe: Zn ratio of the ferrite catalyst was increased. Conversion of 1-butene over an α/γ-Fe2O3 catalyst was shown to be extremely low, < 1%, with 1,3-butadiene and carbon dioxide the main products of the reaction, both had yields of around ~0.2% throughout the time on stream (Figure 11).
Post-Reaction Catalyst Characterisation
XPS
XPS data from post reaction catalyst samples (Table 2) showed an increase in measured Fe: Zn ratio for both the stoichiometric and the 2.5Fe catalysts. The calculated atom percentages show that, for both catalysts, the percentage of both Fe3+ and Zn2+ decrease over the duration of the reaction whilst the percentage of O2- measured at the surface increased.
BET surface area
Post-reaction catalyst surface area measurements, (Table 3), showed a significant decrease in catalyst surface area relative to pre- reaction as a result of sintering in the presence of steam [31]. Average pore diameter is increased post reaction but total pore volume changed very little, suggesting that smaller catalyst pores are closing in over the course of the reaction.
Raman Spectroscopy
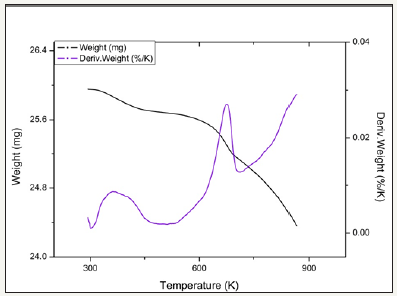
Post reaction Raman spectra showed no observable changes to the catalysts, full results is available in the supplementary information (Figures 12-21).
X-ray diffraction (XRD)
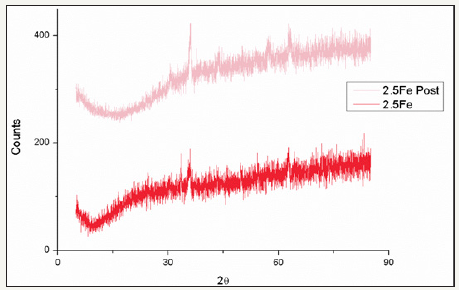
Post reaction XRD patterns showed no changes in terms of peak position, relative intensity or appearance of additional peaks. It was noted however that the post reaction XRD patterns showed slightly better defined peaks and a slightly reduced amorphous background, indicating an increased crystallinity and particle size. Full results for post-reaction XRD are available in the supplementary information (Figures 22-27).
Supplementary Information
Temperature Programmed Reduction
figure 12:TPR profiles for catalyst 2.1Fe.
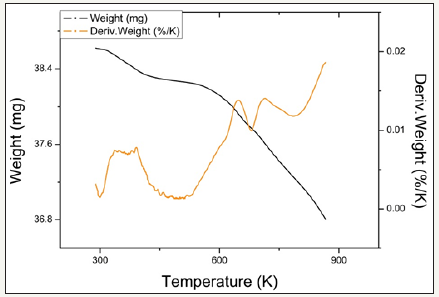
figure 13:TPR profiles for catalyst 2.2Fe
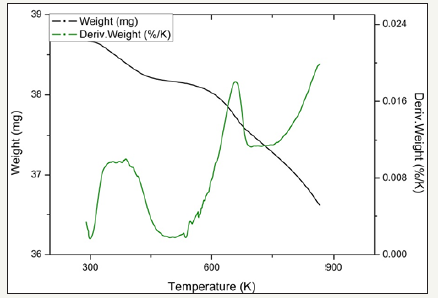
figure 14:TPR profiles for catalyst 2.3Fe.
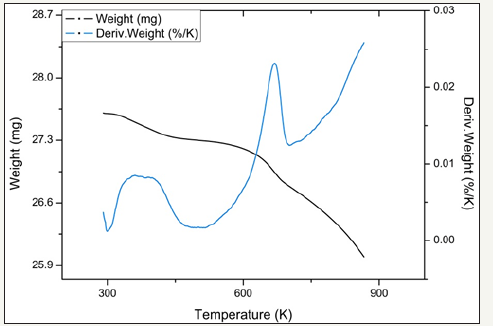
figure 15:TPR profiles for catalyst 2.4Fe.
Post Reaction Raman
figure 16:Comparison of pre and post reaction ferrite Raman spectra for catalyst 2.0Fe.
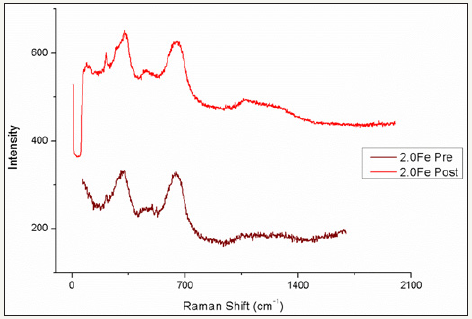
figure 17:Comparison of pre and post reaction ferrite Raman spectra for catalyst 2.1Fe
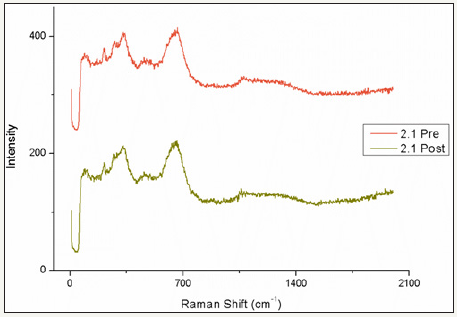
figure 18:Comparison of pre and post reaction ferrite Raman spectra for catalyst 2.2Fe.
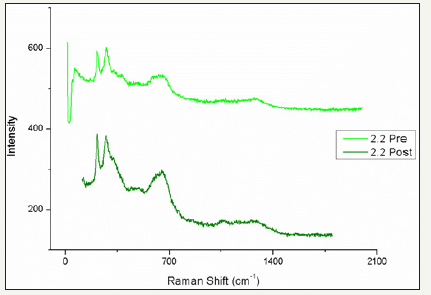
figure 19:Comparison of pre and post reaction ferrite Raman spectra for catalyst 2.3Fe.
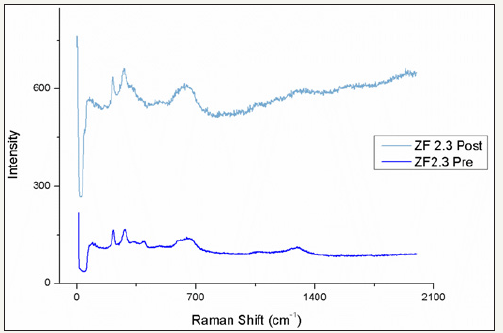
figure 20:Comparison of pre and post reaction ferrite Raman spectra for catalyst 2.4Fe.
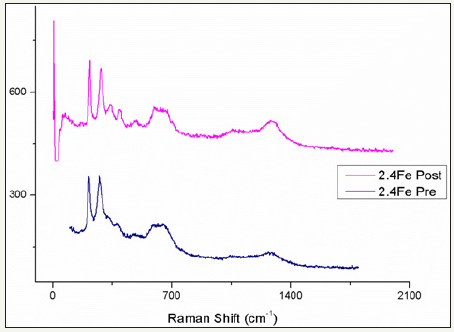
figure 21:Comparison of pre and post reaction ferrite Raman spectra for catalyst 2.5Fe.
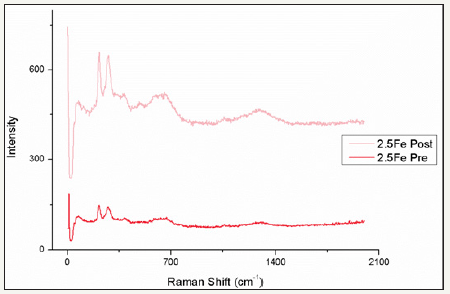
figure 22:Comparison ofpre and post reaction ferrite XRD patterns for catalyst 2.0Fe.

figure 23:Comparison of pre and post reaction ferrite XRD patterns for catalyst 2.1Fe.
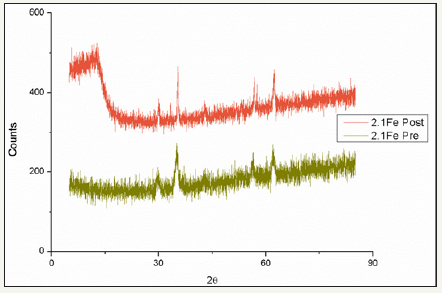
figure 24:Comparison of pre and post reaction ferrite XRD patterns for catalyst 2.2Fe.
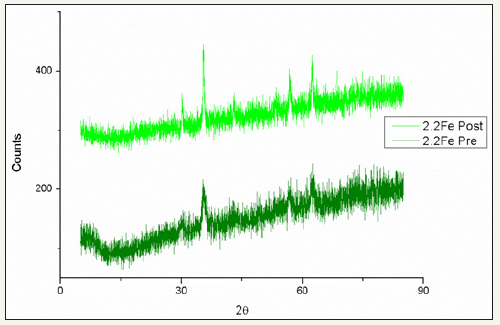
figure 25:Comparison of pre and post reaction ferrite XRD patterns for catalyst 2.3Fe.
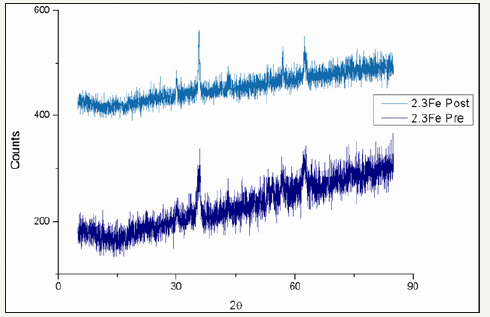
figure 26:Comparison of pre and post reaction ferrite XRD patterns for catalyst 2.4Fe.
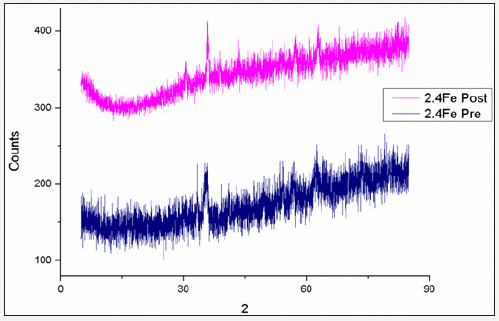
figure 27:Comparison of pre and post reaction ferrite XRD patterns for catalyst 2.5Fe.
Electron paramagnetic spectroscopy (EPR)
All of the post reaction catalysts were examined by EPR spectroscopy for comparison with pre-reaction samples, Figure 3. For all ferrite catalysts tested there was a noticeable peak broadening in the post reaction samples, diagnostic of a structural change in the spinel. The shift towards a normal spinel was greater in the higher Fe: Zn ratio catalysts.
SEM
Post reaction SEM was carried out on all of the ferrite samples and showed very little difference when compared to that of the fresh catalyst. Full results for post reaction SEM can be found in the supplementary information (Figure 28).
Post Reaction SEM
figure 28:Post reaction SEM images of ferrite catalysts a) ZnFe2O4 b) Zn0.9Fe2.1O4 c) Zn0.8Fe2.2O4 d) Zn0.7Fe2.3O4 e) Zn0.6Fe2.4O4 f) Zn0.5Fe2.5O4
Thermogravimetric analysis (TGA)
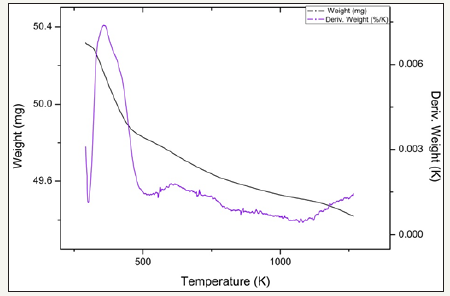
TGA was performed on all of the post reaction catalyst samples in the presence of oxygen. For all catalysts a total weight loss of < 1% was observed over the temperature range 290K to 1265K. The weight loss recorded occurred over the temperature range 303K to 473K and was associated with the loss of adsorbed water from the catalyst. Full results for post-reaction TGA are available in the supplementary information (Figures 29-34).
figure 29:Post reaction TGA results for catalyst 2.0Fe.
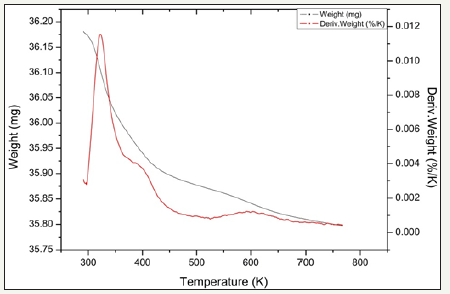
figure 30:Post reaction TGA results for catalyst 2.1Fe.
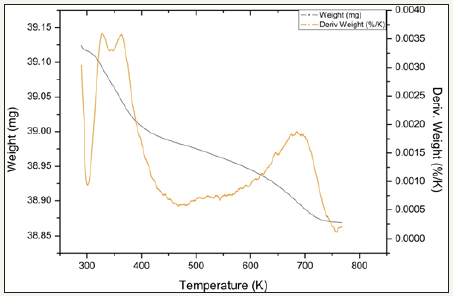
figure 31:Post reaction TGA results for catalyst 2.2Fe.
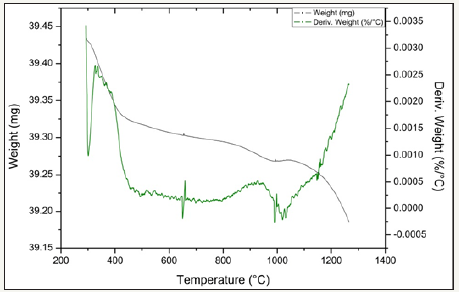
figure 32:Post reaction TGA results for catalyst 2.3Fe.

figure 33:Post reaction TGA results for catalyst 2.4Fe.
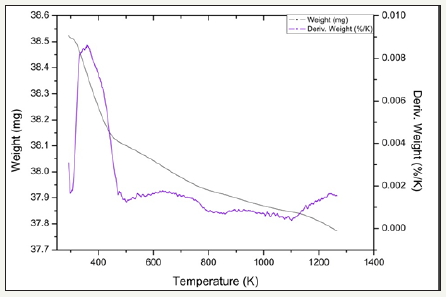
figure 34:Post reaction TGA results for catalyst 2.5Fe.
Discussion
Prior work has left the effect of addition of an excess of Fe3+ on a ZnFe2O4 catalyst in an ambiguous position, with reports of both positive and negative effects on catalytic activity and selectivity. Through extensive catalyst testing and pre and post reaction characterization this work set out to determine the genuine effect of increasing the Fe: Zn ratio on ZnFe2O4, both in terms of changes to the material itself and to its catalytic properties. Results from this work have shown that increasing the Fe: Zn ratio of a zinc ferrite reduces catalytic activity and selectivity. Our results are in agreement with the work of Armendáriz et al. [22] and Young-Min et al. [23] confirming that excess iron is deleterious and in contrast to the studies conducted by Zhang et. Al [19] and Xu et. Al [20] who concluded, contradictory to our own findings, that the presence of an excess of Fe2O3 in a ZnFe2O4 catalyst improves catalytic activity. By thoroughly characterizing our catalysts’ morphology and electronic properties the aim was to understand these differences. The targeted metal ion ratios were measured using atomic absorption measurements for the bulk and XPS for the ferrite surface. A good correlation was observed between target Fe: Zn ratio and that of the bulk ferrite however Fe: Zn ratios measured on the catalyst surface were shown to be notably higher than that of the bulk, a result of the ferrites small particle size, which has been shown to result in Fe3+ enriched surfaces, with surface ion concentrations different to that of the bulk [32].
XRD and Raman spectroscopy confirmed the zinc ferrite phase present in each of the six ferrite catalyst samples. Raman spectroscopy also showed the presence of an α-Fe2O3 phase alongside each of the ferrites, however the secondary phase could only be identified by XRD at the higher Fe: Zn ratio ferrites. The occurrence of a ZnFe2O4/α-Fe2O3 mixed phase, as-identified by XRD, was also documented in a study by Young-Min et al. [23], where it was observed that the mixed phase ZnFe2O4/α-Fe2O3 had a reduced catalytic activity compared to pure ZnFe2O4. EPR spectroscopy highlighted no changes to the catalysts electronic structure with increased Fe: Zn ratio, suggesting that the additional Fe3+ ions were occupying the same electronic position in the spinel as they would in a stoichiometric zinc ferrite. In each case the only feature present in the spectra is a sharp, symmetrical resonance with geff≈ 2.02 for 2.0Fe and 2.1Fe which shifts to geff ≈ 1.94 for 2.2Fe-2.5Fe. BET surface area analysis measured a surface area of 36m2.g-1 for the stoichiometric zinc ferrite, which corresponds well with literature values for zinc ferrite produced by co-precipitation in NaOH solution [23]. An initial increase in surface area from 36- 71m2.g-1 and an increase in average pore diameter from 39 to 95Å were observed as the Fe: Zn ratio was increased from 2 to 2.3. Both parameters then showed a steady decrease with each subsequent increase in Fe: Zn ratio, however even at the highest Fe: Zn ratio tested the surface area and pore diameter was both greater than in the case of the stoichiometric zinc ferrite. Therefore any reduction in activity was not due to a reduction in available surface area or a change in electronic structure of the zinc ferrite. The reduction behaviour of the zinc ferrite catalysts was shown to change as the Fe: Zn ratio was increased. Catalysts with a lower Fe: Zn ratio (2.0Fe and 2.1Fe) showed three distinct areas of weight loss in line with those observed by Liang et al. [33] for ZnFe2O4. As the Fe: Zn ratio was increased there was loss of the reduction peak at ~685K and an increase in the overall percentage weight loss for each catalyst, as a result of an increased reduction peak at ~670K. This indicates that the amount of labile oxygen that could be available for reaction increased with increasing Fe: Zn ratio. The suggested mechanism for the oxidative dehydrogenation of 1-butene [34] is a Mars-van Krevelen type reaction where oxygen plays an important role in the cycle as it is being continually hydroxylated and removed from the catalyst as water before being replenished by gaseous oxygen. It would therefore be expected that increased oxygen lability would be beneficial to a zinc ferrite catalyst for this type of reaction. This is not the case however as there was a decrease in conversion and selectivity with increased Fe: Zn ratio and increased oxygen lability. This increased reducibility of the catalyst may however be a result of reduction of the secondary α-Fe2O3 phase, which has been shown to be more readily reduced, under the conditions investigated, than ZnFe2O4 [35].
It was observed that throughout the time on stream, all of the catalysts tested were active as 1-butene oxidative dehydrogenation catalysts to produce 1, 3-butadiene. Conversion data for the ODH reaction carried out over each of the catalysts, (Figure 8) showed a clear decrease with increasing Fe: Zn ratio, with the stoichiometric catalyst having the highest overall conversion. As Fe: Zn ratio was increased from 2.3 to 2.5 a significant drop in conversion was observed, this may be a result of increased α-Fe2O3 present as a distinct phase to the zinc ferrite, as shown in XRD and Raman data. Young Min et al. [23] noted the negative effect on catalyst activity of a secondary α-Fe2O3 phase alongside ZnFe2O4 for a similar system. SEM data also shows the increased presence of structures present on the catalyst surface at higher Fe: Zn ratios, which may be influencing catalytic activity (Figure 4). Conversion data obtained for α/γ-Fe2O3 as a 1-butene ODH catalyst under the same reaction conditions, revealed a conversion of < 1%. From the 1, 3-butadiene and carbon dioxide yield it can be seen that, in contrast to results presented in studies by Zhang et al. [19] and Straguzzi et al. [36], α-Fe2O3 is virtually inactive as a 1-butene ODH catalyst (Figure 11). Our results are in keeping with those of Makoto et al. [37] who observed a conversion of 3% for a 1-butene ODH reaction carried out over α/γ-Fe2O3. It would therefore be expected that with the increasing appearance of an inactive α-Fe2O3 phase alongside the active ZnFe2O4 phase we would observe a decrease in catalytic activity, as evidenced by conversion data presented in Figure 8.
From Figure 9 it is clear that increasing Fe: Zn ratio of a ZnFe2O4 results in a decrease in 1, 3-butadiene yield. Catalyst 2.0Fe, the stoichiometric zinc ferrite, showed the highest 1, 3-butadiene yield of the catalysts tested, whereas each subsequent increase in Fe: Zn ratio resulted in a drop in 1, 3-butadiene yield. The stoichiometric zinc ferrite also exhibited the highest overall 1, 3-butadiene selectivity, of ~99% throughout time on stream, with the remaining 1% selectivity comprising of minor products such as butane and propane (Table 6). 1, 3-Butadiene selectivity can then be seen to decrease with increasing Fe3+ excess, with catalysts 2.4Fe and 2.5Fe showing the lowest selectivities. Figure 11 shows the yields of 1, 3-butadiene and carbon dioxide for a 1-butene ODH reaction being carried out over a Fe2O3 catalyst, product yields are very low as a result of the low conversion. A carbon dioxide yield of 0.23% and 1, 3-butadiene yield of ~0.25% were observed throughout time on stream, making carbon dioxide and 1, 3-butadiene the two major reaction products. In the tests over the non-stoichiometric catalysts the GC analysis detected small quantities of other hydrocarbons but the system was not sensitive to carbon dioxide, hence it is possible for carbon dioxide be the missing selectivity. To confirm that carbon dioxide could be the other product, the oxygen demand was calculated using the combustion of 1-butene, C4H8 + 6O2 4CO2 + 4H2O, given that this reaction requires six moles of oxygen per mole of 1-butene in comparison to the production of butadiene, which only requires half a mole of oxygen per mole of 1-butene. In all cases sufficient oxygen was available for all of the undetected selectivity to be carbon dioxide.
A variety of minor products were observed in each reaction: methane, ethane, propane, butane and isobutene. In each case these minor products made up < 1% of the total selectivity. Of these minor products, only butane was shown to exhibit a significant change in yield and selectivity with increased Fe: Zn ratio (Figure 10 and Table 7).When the reaction was run over the stoichiometric zinc ferrite, butane had a selectivity of < 1% throughout the time on stream, however this was shown to increase as Fe: Zn ratio increases, with a maximum selectivity of ~7% obtained for catalyst 2.5Fe after 75h on stream. This is a highly unusual result as it implies that there is a hydrogenation reaction taking place under oxidizing conditions. Butane has to be formed by the addition of hydrogen lost from 1-butene, if two 1-butene molecules were adsorbed in close proximity then the hydrogen could be transferred either across the surface, although this would require that the hydrogenation rate of 1, 3-butadiene was faster than the oxidation of hydrogen, or the hydrogen could be transferred by a concerted mechanism as in a trans-hydrogenation [38]. Whatever the mechanism it is clear that the site for this process is not present on stoichiometric zinc ferrite but occurs in the non-stoichiometric systems and increases in concert with the excess iron, suggesting a non-selective, second phase is present.
As the Fe: Zn ratio of the zinc ferrite catalysts was increased the presence of an α-Fe2O3 phase became more pronounced in XRD, Raman and SEM data, whilst at the same time a decrease in selectivity towards 1, 3-butadiene was observed. With catalyst 2.0Fe, the stoichiometric zinc ferrite, no carbon dioxide was produced over the course of the reaction, but separate experiments examining α-Fe2O3 as an independent catalyst showed a moderate selectivity towards carbon dioxide. Therefore as the catalyst Fe:Zn ratio is increased, some of the additional Fe3+ being supplied is being incorporated not into the spinel but is forming a separate α-Fe2O3, as evidenced by the catalyst characterization. The α-Fe2O3, phase has been shown by results in this paper and those in the literature to be inactive as a catalyst in the 1-butene ODH process, therefore the increased incorporation of α-Fe2O3 into a ZnFe2O4 catalyst, particularly on the catalyst surface, would be expected to reduce catalytic activity, as shown in our 1-butene conversion results (Figure 8). It would also be expected that 1, 3-butadiene selectivity would drop as a result of a competing combustion reaction catalyzed by the presence of α-Fe2O3 on the catalyst surface. Studies by Zhang et al. [19], which show results indicating that a mixed phase ZnFe2O4/α-sub>2O3 catalyst has increased catalytic activity compared to pure ZnFe2O4, unfortunatelydo not describe the other products of the reaction, or whether a competing combustion reaction was observed.
To determine what effect the reaction process has on the catalysts, post-reaction characterization was performed. Unfortunately, studies looking at similar systems only include very limited post reaction catalyst characterization for comparison [18- 20]. Post reaction XPS carried out on catalysts 2.0Fe and 2.5Fe show an increase in both the Fe: Zn ratio and the percentage of O2- present at the surface of both catalysts over the course of the reaction. BET surface area data for all of the post reaction catalysts showed a decrease in surface area, indicating sintering of the catalyst surface during the reaction. The reaction was repeated with a steam-only feed and a similar reduction in surface area was observed for the zinc ferrite. This indicates that the sintering is occurring as a result of interaction between the catalyst and the steam in the feed and not as a result of the ODH process itself. Such surface area decrease would typically result in an increase in catalyst particle size: this was confirmed by EPR spectroscopy. Evidence in the literature also suggests that as zinc ferrite particle size is decreased from the bulk there is a movement towards a more inverse spinel structure, therefore it would be expected that as the zinc ferrite sintered during reaction and the particle size increased, as evidenced by XRD and BET surface area results, that the EPR spectra should also broaden [16]. The observed EPR spectrum stems from the paramagnetic Fe3+ions primarily located in the octahedral sites of the structure [39-41]. With nano sized particles showing a mixed spinel structure, where a proportion of Fe3+ ions are located in tetrahedral sites. This effects the spin coupling, coined exchange, between the two Fe3+ ions and the overall profile of the EPR spectrum. In normal spinels, the Fe3+ reside in adjacent octahedral where the Fe–O–Fe bond angle of ~90° gives rise to poor orbital overlap and an inherently weak exchange interaction [42]. In contrast, the linear Fe–O–Fe angle for a ferrite with half the Fe3+ in octahedral sites and the other half in tetrahedral sites gives rise to a very strong exchange interaction. This structure is ferrimagnetic because the octahedral and tetrahedral sub lattices are anti parallel and with twice as many octahedral sites than tetrahedral ones, the magnetic moment is uncompensated. It has previously been determined that stoichiometric zinc ferrite displays a short range anti ferromagnetic ordering at higher temperatures, which gives rise to the super paramagnetism at room temperature [43,44]. The prepared zinc ferrites are also super paramagnetic; hence it was necessary to dilute the samples in ZnO in order to carry out the EPR measurements in the 0.34T magnetic fields. Exchange coupling leads to a narrowing of the EPR line width; hence the stronger the exchange interaction the narrower the line. For the pre-reaction catalysts, the narrow line width is indicative of a proportion of the Fe3+ in tetrahedral holes, with the stoichiometric zinc ferrite having the largest occupancy, which decreased with increasing Fe content. The contrast with the post-reaction samples is abundantly clear from the overlay presented in Figure 3. The substantially increase in the line width, which transverses the series incrementally from 10mT for stoichiometric 2.0Fe to 94mT for 2.5Fe confirms the reaction process leads to a mobilization the Fe3+ ions and decrease in their occupancy of the tetrahedral sites, giving the post-reaction zinc ferrite a more normal spinel structure, which is commensurate with larger particles
Conclusion
The aim of this work was to determine the effect of increasing the Fe: Zn ratio of ZnFe2O4 on its catalytic activity for 1-butene ODH. We have clearly shown that as the Fe: Zn ratio was increased the catalytic activity and 1, 3-butadiene selectivity were significantly reduced. A series of six zinc ferrite catalysts were produced with increasing Fe: Zn ratios. XRD and Raman of pre-reaction catalysts showed the presence of α-Fe2O3 at even a small excess of Fe. SEM results also show the presence of structures present on the catalyst surface. The ferrites were tested as catalysts for the oxidative dehydrogenation of 1-butene and it was observed that with increasing Fe: Zn ratio, conversion, 1, 3-butadiene yield and 1, 3-butadiene selectivity decreased. Results from 1-butene ODH over a pure α-Fe2O3 showed a low 1, 3-butadiene selectivity as a result of a competing combustion reaction producing carbon dioxide in agreement with the work of Kung [45]. It is therefore suggested that as α-Fe2O3 was produced alongside the zinc ferrite phase, as the Fe: Zn ratio increased, it resulted in a decreased 1, 3-butadiene selectivity in favor of the production of carbon dioxide. Butane was also shown to be promoted by an increased Fe: Zn ratio in the catalyst, possibly due to a trans-hydrogenation reaction. All catalysts showed a deactivation over the course of the ODH reaction, which correlates with a decrease in surface area post-reaction as a result of sintering in the presence of steam and the movement of Fe3+ ions over the course of the reaction from tetrahedral to octahedral holes, moving towards a more normal spinel structure.
Acknowledgement
The authors would like to acknowledge funding for this project from Invista Textiles (UK) and the provision of a studentship for one of us (CB). X-ray Photoelectron Spectroscopy (XPS) was performedat the National EPSRC XPS Users’ Service (NEXUS) at Newcastle University, an EPSRC Mid-Range Facility.
References
- Armstrong HE, Miller AK (1886) The decomposition and genesis of hydrocarbons at high temperatures. I. The products of the manufacture of gas from petroleum. The Journal of the Chemical Society 49: 74-93.
- White WC (2007) Butadiene production process overview. Chemico Biological Interactions 166(1-3): 10-14.
- Market Research Report (2014) 1,3 Butadiene (BD) market analysis by application (Butadiene Rubber, ABS, SBR, SB Latex, NBR, Hexamethylenediamine), bio-based opportunities and segment forecasts To 2020. Market Research Report.
- Angelici CW, Weckhuysen BM, Bruijnincx PC (2013) Chemocatalytic conversion of ethanol into butadiene and other bulk chemicals. ChemSusChem 6(9): 1595-1614.
- Finocchio E, Busca G, Ramis G, Lorenzelli V (1997) On the mechanism of the selective oxy-dehydrogenation of n-butenes to 1,3-butadiene on magnesium ferrite: an FT-IR study. Studies in Surface Science and Catalysis 110: 989-998.
- Lee H, Jung JC, Song IK (2009) Factors affect on the reaction performance of the oxidative dehydrogenation of n-butene to 1,3-butadiene over znferrite catalysts. Catalysis Letters 133: 321-327.
- Toledo JA, Bosch P, Valenzuela MA, Montoya A, Nava N (1997) Oxidative dehydrogenation of 1-butene over ZnAl ferrites. Jourrnal of Molecular Catalysis 125(1): 53-62.
- Lee H, Jung CJ, Kim H, Chung YM, Kim TJ, et al. (2008) Effect of divalent metal component (MeII) on the catalytic performance of MeIIFe2O4 catalysts in the oxidative dehydrogenation of n-butene to 1,3-butadiene. Catalysis Letters 124: 364-368.
- Gibson MA, Hightower JW (1976) Oxidative dehydrogenation of butenes over magnesium ferrite kinetic and mechanistic studies. Journal of Catalysis 41(3): 420-430.
- Rennard RJ, Kehl WL (1971) Oxidative dehydrogenation of butenes over ferrite catalysts. Journal of Catal 21(3): 282-293
- Kung HH, Kung MC (1985) Selective oxidative dehydrogenation of butenes on ferrite catalysts. Advances in Catalysis 33: 159-198.
- Park JH, Row K, Shin CH (2013) Oxidative dehydrogenation of 1-butene to 1,3-butadiene over BiFe0.65NixMo oxide catalysts: Effect of nickel content. Catalysis Communications 31: 76-80.
- Hong E, Park JH, Shin CH (2016) Oxidative dehydrogenation of n-butenes to 1,3-butadiene over bismuth molybdate and ferrite catalysts: a review. Catalysis Surveys from Asia 20(1): 23-33.
- Yan W, Kouk QY, Luo J, Liu Y, Borgna A (2014) Catalytic oxidative dehydrogenation of 1-butene to 1,3-butadieneusing CO2. Catalysis Communication 46: 208-212
- Putnis A (1992) An introduction to mineral sciences. Cambridge University Press,USA.
- Anantharaman MR, Jagatheesan S, Malini KA, Sindhu A, Narayanasamy A, et al. (1998) On the magnetic properties of ultra-fine zinc particles. Journal of Magnetism and Magnetic Materials 189(1): 83-88.
- Hochepied JF, Bonville P, Pileni MP (2000) Nonstoichiometric zinc ferrite nanocrystals: syntheses and unusual magnetic properties. Journal of Physical Chemistry 104(5): 905-912.
- Chung YM, Kwon YT, Kim TJ, Lee SJ, Oh SH (2009) Prevention of catalyst deactivation in the oxidative dehydrogenation of n-butene to 1,3-butadiene over zn-ferrite catalysts. Catalysis Letters 131: 579-586.
- Zhang M, Lan R, Liu J, Cheng X, Zhou W (1992) Phase cooperation between ZnFe2O4 and α-Fe2O3 phases of ferrite catalysts in the oxidative dehydrogenation on n-butenes. Journal of the Chemistry Society Faraday Transactions 88(4): 637-644.
- Xu WQ, Yin YG, Li GY, Chen S (1992) Roles of spinel and maghemite phases in the oxidative dehydrogenation of butene over iron complex oxides. II. Epitaxy and synergy between γ-Fe2O3 and ferrite spinels. Applied Catalysis A: General 89(2): 131-142.
- Miao C, Wu W, Fan Z, Zeng T, Ma C, et. al (2014) Catalyst for the oxidative dehydrogenation of butene to butadiene and preparation process thereof. China Petroleum & Chemical Corporation and Shanghai Research Institute of Petrochemical Technology Sinopec.
- Armendáriz H, Aguilar Rios G, Salas P, Valenzuela MA, Schifter I (1992) Oxidative dehydrogenation of n-butane on iron-zinc oxide catalysts. Applied Catalysis A: General 92(1): 29-38.
- Young Min C, Kwon YT, Kim TJ, Lee SJ, Oh SH (2009) Factors affect on the reaction performance of the oxidatie dehydrogenation of n-butene to 1,3-butadiene over zn-ferrite catalysts. Catalysis Letters 130: 417-423.
- Wang Z, Schiferl D, Zhao Y, Oneill HSC (2003) High pressure raman spectroscopy of spinel-type ferrite ZnFe2O4. Journal of Physics and Chemistry of Solids 64(12): 2517-2523.
- Singh JP, Srivastava RC, Agrawal HM, Kumar R (2011) Micro-Raman investigation of nanosized zinc ferrite: effect of crystallite size and fluence of irradiation. Journal of Raman Spectroscopy 42(7): 1510-1517.
- Shim SH, Duffy TS (2002) Raman spectroscopy of Fe2O3 to 62 GPa. American Mineralogist 87: 318-326.
- Lin X, Zhang Y, Yin L, Chen C, Zhan Y, et al. (2014) Characterization and catalytic performance of copper-based wgs catalysts derived from copper ferrite. International Journal of Hydrogen Energy 39(12): 6424- 6432.
- Kamari MH, Naseri GM, Saion BE (2014) A novel research on behavior of zinc ferrite nanoparticles in different concentration of poly(vinyl pyrrolidone) (PVP). Metals 4(2): 188-129.
- Ren P, Zhang J, Deng H (2009) Preparation and microstructure of spinel zinc ferrite ZnFe2O4 by Co-precipitation method. Journal of Wuhan University of Technology Mater Sci Ed 24(6): 927-930.
- Bleaney ABA (1970) Electron Paramagnetic Resonance of Transition Ions. Clarendon Press, Oxford, UK.
- Spence RR (2014) The Oxidehydrogenation of C-4 Alkenes over Zinc Ferrite. University of Glasgow, Scotland, UK.
- Ballarini N, Cavani F, Passeri S, Pesaresi L, Lee A, et al. (2009) Phenol methylation over nanoparticulate CoFe2O4 inverse spinel catalysts: The effect of morphology on catalytic performance. Applied Catalysis A: General 366(1): 184-192.
- Liang M, Kang W, Xie K (2009) Comparison of reduction behavior of Fe2O3, ZnO and ZnFe2O4 by TPR technique. Journal of Natural Gas Chemistry 18(1): 110-113.
- Lee H, Jung JC, Song IK (2009) Oxidative dehydrogenation of n-butene to 1,3-butadiene over sulfated ZnFe2O4 catalyst. Catalysis Letters 133(3-4): 321-327.
- Valenzuela MAB, Bosch P, Jimmenez Becerrill J, Quiroz O, Paez AI (2002) Preparation, characterization and photocatalytic activityof ZnO, Fe2O3 and ZnFe2O4. Journal of Photochemistry and Photobiology A: Chemistry 148(1-3): 177-182.
- Straguzzi GI, Bischoff KB, Koch TA, Schuit GCA (1987) Selective oxidation catalysts containing antimony for the conversion of 1-butene to butadiene: II. Selective oxidation of 1-butene and CO. Journal of Catalysis 104(1): 47-58.
- Makoto M, Sakata K, Ueda F, Nazawa Y, Yoneda Y (1980) Catalytic properties of iron oxide. III. Oxidative dehydrogenation of butenes over iron oxide catalysts. The Chemical Society of Japan 53: 648-652.
- Garba MD, Jackson SD (2017) Catalytic upgrading of refinery cracked products by trans-hydrogenation: a review. Applied Petrochemical Research 7(1): 1-8.
- Kong L, Jiang Z, Xiao T, Lu L, Jones MO, et al. (2011) Exceptional visiblelight- driven photocatalytic activity over BiOBr–ZnFe2O4 heterojunctions. Chemical Communications 47(19): 5512-5514.
- Singh JP, Srivastava RC, Agrawal HM, Kushwaha RPS, Chand P, et al. (2008) EPR Study of Nanostructured Zinc Ferrite. International Journal of Nanoscience 7(1): 21-27.
- Zhang P, Phan TL, Yu SC (2012) Electron-spin-resonance study of polycrystalline Fe-doped ZnO ceramics. Journal of the Korean Physical Society 61(10): 1563-1567.
- Bercoff PG, Bertorello HR (1997) Exchange constants and transfer integrals of spinel ferrites. Journal of Magnetism and Magnetic Materials 169(3): 314-322
- Bean CP, Livingston JD (1959) Superparamagnatism. Journal of Applied Physics 30: S120-S129.
- Köseoglu Y, Yildiz H, Yilgin R (2012) Synthesis, characterization and superparamagnetic resonance studies of ZnFe2O4 nanoparticles. Journal of Nanoscience and Nanotechnology 12(3): 2261-2269.
- Yang BL, Kung MC, Kung HH (1984) Reasons for the different selectivities in the selective oxidation of butene on α- and γ-Fe2O3. Journal of Catalysis 89(1): 172-176.
© 2018 S David Jackson. This is an open access article distributed under the terms of the Creative Commons Attribution License , which permits unrestricted use, distribution, and build upon your work non-commercially.
 a Creative Commons Attribution 4.0 International License. Based on a work at www.crimsonpublishers.com.
Best viewed in


.jpg)


 Editorial Board Registrations
 Submit your Article
 Refer a Friend
 Advertise With Us
.jpg)


.jpg)


.bmp)
.jpg)
.png)
.jpg)


.png)

.png)


.png)


