
- About Us
- Guidelines
-

The Author ensures that the research has been conducted responsibly and ethically with adherence to all relevant regulations. read more..
- For Authors
- For Reviewer
- Manuscript Guidelines
- Membership
-
- Journals
- Reprints
- e-Books
- Videos
- Indexing
- Contact Us
 COVID-19
- Submissions


Full Text
Progress in Petrochemical Science
XRD Evaluation of Clay Minerals in Shaley Formation and Its Comparison With Cross Plotting of Log Data
Ghassem Alaskari MK*
Petroleum University of Technology (PUT) and PGPZ-International, Iran
*Corresponding author: Ghassem Alaskari MK, Petroleum University of Technology (PUT) and PGPZ-International, Iran
Submission: February 22, 2018; Published: March 21, 2018

ISSN 2637-8035Volume1 Issue3
Abstract
The aim of this research is to determine the percentage of clay minerals by X-Ray Diffraction (XRD) technique and compare with the range of CGR log data. The random orientation of the samples is more suitable for analysis of clay minerals using the X-Ray diffraction technique. Evaluation of clay minerals in shaley zones has long been a difficult task. Presence of shale and shaley zones in some of the reservoir formations can introduce uncertainties in determination and evaluation of petro physical parameters. Percentage of clay minerals, shale types and shale volume has to be considered exactly in this case. Existence of shale reduces porosity and permeability of the reservoir to some extent. Shale distributed in sand and carbonates in many different types. Each of these shale types has different effects on porosity, permeability and water saturation of a reservoir formation. Dispersed shale reduces porosity and permeability to a great extent, but laminar and structural shale have less effect on petro physical parameters. In this investigation shale types, shale volume and effective porosity of shaley reservoir formations have been determined from well log data based on cross plotting of the CGR log. In other words, a triangle Density-Neutron porosity cross plot is used to determine and correct the above parameters. The area of study lies in central oil fields of Iran, where well log data and core samples are used (Tabnak Field, Well-C). Well-C selected to study the Kangan Formation (Upper Khuff) at different depths interval. A comparison between the clay minerals determined by XRD and by cross plotting of log data is satisfactory. This study illustrates that distribution of shale types in Well-C is mainly dispersed shale with few of laminar shale and the percentage of effective porosity (φe) decreases with increasing depth along well-C in Kangan Formation. The great match between the shale type determined by the cross plotting of neutron vs. density porosities after correction for gas effects and by the result of Scanning Electron Microscopy (SEM) for the same core sample is interesting. Finally, we found that the cross-plotting techniques used in this investigation can determine shale types, shale volume, clay minerals and effective porosity with acceptable accuracy.1
Keywords: Percentage of Clay Minerals; XRD Evaluation; Cross Plotting of Log Data; Comparison
Shale Volume Estimation
Shale volume can be estimated from the gamma ray log. The following equation is used to determine the Gamma ray index [1]
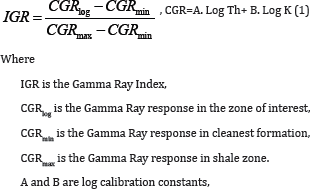
The shale volume (Vsh) can be calculated from the Gamma ray index in shaley formation
Vsh =IGR/ [3 - 2IGR] (2)
Corrections of Reservoir Parameters in Shaley Formation
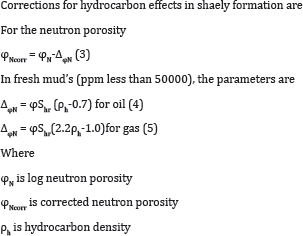
Methodology of Cross Plotting
We used the above algorithm to correct reservoir parameters and used the cross plotting techniques to evaluate the clay minerals [5]. The first cross plotting must be done (Figure 1) based on Thorium vs. Potassium from CGR log data [6]. If shaley formation contains hydrocarbons, Neutron and Density porosities have be corrected before the second cross plotting is done [7].
Figure 1: Log interpretation chart of the first cross plotting used to evaluate the clay minerals [6].

Field Data Analysis (Kangan Formation or Upper Khuff Section)
Figure 2: Right: Locations of Well-C and Well-A in Tabnak Field, left: the top and the bottom of Kangan Formation.

The Kangan Formation is one of the largest carbonate reservoirs located in the South Pars Field, which is one of the major gas fields in the central basin of the Persian Gulf. Facies analyses indicate that the Kangan carbonates are formed in four micro facies belts: tidal flat, lagoon, shoal, and shallow open marine, in a platform ramp environment. The isotopic compositions of the Kangan carbonates indicate that they were deposited in shallow tropical waters. Location of well-C in Kangan Formation is shown in Figure 2. Data parameters for well-C are given in Table 1.
Analysis of core sample (2) of Kangan 2 formation (Table 1) at depth 2645.7m:
For core sample-2, kangan-2, well-C, the dominate mineral based on the XRD spectrum is illite (Table 2). The log data is shown in Figure 3. Using cross plot of Thorium vs. Potassium in Figure prevailing mineral, because mica was used in the drilling fluid and 4, the mineralogy according to cross plot in Figure 4 is mica as detected by the tools.
Table 1: CEC Results and the XRD sample locations along Well-C, Tabnak Field.

Figure 3: Petro physical logs for depth interval 2637-2652m in the range of core sample-2 (2645.7m), Kg-2, Well-C.

Core sample-2 in the depth 2645.7m in range of Log data in Figure 3 located in the field of kangan-2 in the well-C. The shale amount is low and geologically the dominate composition are calcite and dolomite respectively. The green color points show the limits of the evaluating core sample data considered in the cross plot of Figure 4. The domain limits shows the shale type in Figure 5. Shale value in this domain ranges between 0 to 15 percents and porosity of 1 to 7 percents. Considering the fact that the domain of the study was gaseous and verification of gas effect over shale porosity was corrected. Cross plot in Figure 5 shows shale type is the dispersed shale.
Figure 4: The first cross plot of Thorium vs. Potassium forKg-2, Well-C (depth interval 2637-2652m). Green colour points in the range of core sample-2.

Analysis of core sample (3) of Kangan 2 formation (Table 1) at depth of 2666.7m
Figure 5: The second cross plot FD-FN for depth interval (2644-2648m), Kg-2, Well-C. Green Colour points in the range of core sample-2.

For core sample-3, kangan-2, well-C, the dominate mineral based on the XRD spectrum is illite (Table 3). The log data is shown in Figure 6. Using cross plot of Thorium vs. Potassium in Figure 7, the mineralogy according to cross plot is mica as prevailing mineral, because mica was used in the drilling fluid and detected by the tools.
Figure 6: Petro physical logs for depth interval 2660-2675m, Kg-2, Well-C, Tabnak field in the range of core sample-3.

Core sample-3 in depth 2666.7m for the range of log data in Figure 5 located in the field of kangan 2 in well-C. The shale amount is low and geologically the dominate composition is calcite. The green color points show the limits of the evaluating core sample data considered the cross plot of figure 7, the domain limits show the shale type in Figure 8. Shale value in this domain ranges between 0 to 30 percents and porosity of 1 to 14 percents. Considering the fact that the domain of the study was gaseous and verification of gas effect over shale porosity was corrected. Cross plot in Figure 8 shows the shale type is the dispersed shale.
Analysis of core sample (4) of Kangan 3 formation (Table 1) at depth of 2672.4m
For core sample-4, kangan-3, well-C, the dominate mineral based on the XRD spectrum is illite (Table 4). The log data is given in Figure 9. Using cross plot of Thorium vs. Potassium in Figure10, the mineralogy according to cross plot is illite and some mica as prevailing minerals. Mica was used in the drilling fluid and detected by the tools.
Table 2: The percentage of clay minerals in core sample-2, Kg-2, Well-C, Tabnak Field (depth 2645.7m).

Figure 7: The first cross plot of Thorium vs. Potassium for depth interval 2660-2675m, Kg-2, Well-C. Green colour points in the range of core sample-3 (depth2666.7m).

The core sample-4 (depth 2672.4m) in the range of log data in Figure 9 located in the kangan-3 Formation in well-C. The shale amount is low and geologically the dominate composition is calcite. The green color point's show the limits of the evaluating core sample data considering the cross plot of Figure 10, the domain limits show the shale type in Figure 11. Shale value in this domain ranges between 0 to 20percents and porosity of 1 to 15 percents. Considering the fact that the domain of the study was gaseous and verification of gas effect over shale porosity was corrected. Cross plot in Figure 11 shows shale type is dispersed shale.
Table 3: The percentage of clay minerals in core sample-3, Kg-2, Well-C, Tabnak field (depth 2666.7m).

Table 4: The percentage of clay minerals in Kg-3, Well-C, Tabnak field for the coresample-4 (depth 2672.4 m).

Figure 8: The second cross plot FD-FN, for depth interval 2664-2668m, Kg-2, Well �C. Green colour points in the range of core sample-3 (depth 2666.7m).

Figure 9: Petro physical logs in Kg-3, Well-C, Tabnak field for depth interval (2667-2682m).

Figure 10: The first cross plot of Thorium vs. Potassium for Kg-3, Well-C, in depth interval (2667-2682m). Green colour points in the range of core sample-4 (depth 2672.4m).

Figure 11: The second cross plot FD-FN, for Kg-3, Well- C, for depth interval (2670-2674m). Green colour points in the range of core sample-4 (depth 2672.4m).

Analysis of core sample (5) of Kangan-3 formation (Table 1) at depth of 2680.2m
Table 5: The percentage of clay minerals in Kg-3, Well-C, Tabnak field for the core sample-5 (depth 2680.2m).

Figure 12: Petro physical logs for Kg 3, Well-C, Tabnak field for depth interval (2678-2692m).

For the core sample-5 of kangan-3, well-C, the dominate mineral based on the XRD spectrum is illite (about 60% in Table 5). The log data is shown in Figure 12. Using cross plot of Thorium vs. Potassium in Figure 13, the dominate mineralogy according to cross plot is illite. For this example there is no effect of mica on the tools. Therefore, there is complete match between the results of the XRD in Table 5 and the cross plot shown in Figure 13.
Figure 13: The first cross plot of Thorium vs. Potassium for Kg-3, Well-C, for depth interval (2678-2692m). Green colour points in the range of core sample-5 (depth 2680.2m).

The core sample-5 in depth 2680.2m is in the range of log data shown in Figure 12. The shale amount is high and geologically the dominate compositions are calcite, anhydrite and shale respectively. The green points shows the limits of the evaluating sample considering the cross plot of Figure 13, the domain limits show the shale type in Figure 14. Shale volume for the sample in this domain ranges between 20 to 50 percent and porosity of 1 to 10 percent. Green points in Figure 14 relate to location of sample points which indicate that the shale type is dispersed shale.
Considering the cross plot for the core sample-5 in Figure 14 and the Scanning Electron Microscopy (SEM) for the same core sample in Figure 15 indicate that the shale type is a dispersed shale. The scanning electron microscope (SEM) uses a focused beam of high-energy electrons to generate a variety of signals at the surface of solid specimens. SEM can achieve resolution better than lnanometer. The result of comparison between the cross plot in Figure 14 and the SEM in Figure 15 is satisfactory.
Figure 14: The second cross plot ϕDϕN, for Kg-3 Formation, Well-C, for depth interval (2677-2681m).

Figure 15: SEM from the core sample-5 at depth of 2680.2m, Kg-3, Well-C, Tabnak field. Shale type is dispersed shale. This is also verified by the cross plot in Figure 14.

Results
Similar analysis is done in many depth intervals in Kagan Formation, Well-C, Tabnak field. Using cross-plotting methods,shale types, shale volume and effective porosity for each depth interval have been estimated after corrections for the hydrocarbon effects. The following results can be listed as:
i. The cross-plotting methods can be used to determine shale types, shale volume, clay minerals and effective porosity with acceptable accuracy.
ii. These techniques illustrate the distribution of shale types in Kangan Formation as dispersed shale with few of laminar shale.
iii. Based on the effective porosity estimated from crossplotting in shaley formation, reservoir quality decreases with increasing depth in a long well-Cof Kangan Formation.
Conclusion
In case of structural shale, corrections for effective porosity and gas saturation are not necessary. In case of laminated and dispersed shale's, corrections for the effective porosity are essential. In case of gas saturated shale of any type, correction is needed. The clay minerals and the percentage of clay minerals determined by the cross plotting of Thorium vs. Potassium and by the analysis of XRD spectrums are satisfactory. The great match between the shale type determined by the cross plotting of neutron-density porosities after correction for gas effects and by the SEM result for the same core sample is interesting.
References
- Dresser Atlas (1982) well logging and interpretation techniques. Dresser Industries Corporation, Houston, Texas.
- Brock j (1986) Applied open hole log analysis. Gulf publishing company, Houston, Texas, US 2: 1-292.
- Archie G (1942) The electrical resistivity log as an aid in determining some reservoir characteristics. Transactions of the AIME 146(1): 54-62.
- Ghassem Alaskari MK (2012) Analysis of shaley reservoir zones and their effects on logging tools for interpretation of reservoir parameters in coastal fars fields of Iran. Iranian Central Oil Fields Company, Iran.
- Ghassem Alaskari MK (2016) Petro physical lab testing. Institute of Rahenovin, Tehran, Iran.
- Schlumberger (1985) Log interpretation charts. Schlumberger, New York, USA: pp.207.
- Ghassem Alaskari MK and Roozmeh A (2017) Determination of Shale Types using Well Logs. Int J Petrochem Sci Eng 2(5): 00051.
© 2018 Ghassem Alaskari MK. This is an open access article distributed under the terms of the Creative Commons Attribution License , which permits unrestricted use, distribution, and build upon your work non-commercially.
Editor In Chief


.jpg)


Signup for Newsletter

Quick Links
 Editorial Board Registrations
 Submit your Article
 Refer a Friend
 Advertise With Us
Our Recent Edition

.jpg)


Top Editors


.jpg)


.bmp)
.jpg)
.png)
.jpg)


.png)

.png)


.png)


Financial Support

Sponsors

Latest e-Books

Latest Video

 a Creative Commons Attribution 4.0 International License. Based on a work at www.crimsonpublishers.com.
Best viewed in
a Creative Commons Attribution 4.0 International License. Based on a work at www.crimsonpublishers.com.
Best viewed in