
- About Us
- Guidelines
-

The Author ensures that the research has been conducted responsibly and ethically with adherence to all relevant regulations. read more..
- For Authors
- For Reviewer
- Manuscript Guidelines
- Membership
-
- Journals
- Reprints
- e-Books
- Videos
- Indexing
- Contact Us
 COVID-19
- Submissions


Full Text
Open Access Biostatistics & Bioinformatics
Review on Parametric and Nonparametric Methods of Efficiency Analysis
Erkie Asmare1* and Andualem Begashaw2
1 Bahir Dar Fisheries and Other Aquatic Life Research Center, Ethiopia
2 Department of Agricultural Economics, Mizan Tepi University, Ethiopia
*Corresponding author:Erkie Asmare Beyene, Bahir Dar Fisheries and Other Aquatic Life Research Center, Bahir Dar, Ethiopia
Submission: July 06, 2018;;Published: August 15, 2018

ISSN: 2577-1949 Volume2 Issue2
Abstract
Efficiency analysis using parametric and nonparametric methods have monopolized the recent literature of efficiency measurement. However, the choice of estimation method has been an issue of debate. This review was aimed to: provide information on the concepts, types and methods of applying parametric and nonparametric methods of efficiency analysis and review on the advantages and disadvantages of the two methods of efficiency analysis. Parametric methods of efficiency analysis have significant advantages by distinguishing and modeling the random noise from inefficiency. However, this method requires specification of the model and separating random noise from the true in efficiency may be restrictive in most cases. On the other hand, the nonparametric method has the potential to impose axiomatic properties and estimate the frontier nonparametrically. In addition, it has gained popularity because of it does not have as many restrictive assumptions as parametric method. However, nonparametric methods have deficiencies; because of it does not distinguish between the true inefficiency and statistical noise effects. Therefore, the full distance from a brand to the efficiency frontier is interpreted as inefficiency. Generally, the parametric technique is more attractive when the data suffer from serious measurement errors and random events. On the other way, nonparametric may be a better choice when random disturbances are less of an issue. Therefore, a parametric and nonparametric method is not direct competitors but rather complements: in the trade off between parametric and nonparametric, something is sacrificed for something to be gained. Hence, joint use of parametric and non-parametric techniques to the measurement of efficiency is a novel issue in efficiency study.
Keywords: Efficiency analysis; Stochastic frontier; Random noise; Data envelopment analysis
Introduction
A country’s ability to improve its standard of living over time depends almost entirely on its ability to raise its output per a worker [1]. Efficiency study is an important area of economic analysis that has attracted the attention of economists, especially in the last three decades [2]. According to Kuosmanen T et al. [1] efficiency analysis is an important and extensive research area that provides answers to such essential questions as: Who are the best performing firms and can we learn something from their behavior? What are the sources of efficiency differences across firms? Can efficiency be improved by government policy or better managerial practices? Are there benefits to increasing the scale of operations?
Assessing efficiency for different levels of economic sectors has relevant practical implications, and thus, efficiency has become an essential research field [3]. International literature contains a large number of surveys and case studies dealing with efficiency, which represents the key factor to reach the global target of sustainable development [3]. Particularly, parametric frontier models and nonparametric methods of efficiency analysis become dominated in the field of efficiency analysis [3-5]. These two approaches have been employed as a measure of Economic Efficiency (EE) of various sectors [6]. Majority of efficiency studies have been motivated by the desire to estimate or measure economic efficiency based on either parametric or non-parametric frontier methods.
Unfortunately, there no commonly accepted methodology of efficiency analysis currently [1]. In addition, the choice of estimation method has been an issue of debate, with some researchers preferring the parametric and others the non-parametric approach [1,7]. Since both parametric and non-parametric techniques have their own merits, the selection of a suitable estimation method has been quite controversial. Furthermore, the choice of an estimation approach can influence the conclusion of efficiency and policy implications derived from the analyses [6]. In contrary to this, Toma P et al. [3] and Hildreth et al. [8] reported that the two approaches of efficiency measures (parametric and non-parametric methods) achieve highly correlated results in most cases.
Therefore bridging the gap between these two methods of efficiency analysis have been one of the most important issues in the field of efficiency analysis. Hence, this review paper contributes to the body of knowledge by reviewing different research papers (published up to 2017) that focused on parametric and nonparametric methods of efficiency analysis. Therefore, the specific objectives of this review paper were:
a. To provide information on the concepts and types of parametric and nonparametric methods of efficiency analysis.
b. To give insight on the methods of applying these two efficiency analysis methods.
c. To review on the advantage and disadvantages of parametric and nonparametric methods of efficiency analysis.
Concepts of Efficiency Using Parametric and Nonparametric Methods of Efficiency Analysis
Efficiency is defined as the ratio between outputs and inputs, and we can describe it as a distance between the quantity of input and output [9,10]. The term Economic Efficiency (EE), is an overall efficiency consisting of both the Technical Efficiency (TE) and Allocative Efficiency (AE) of individual firms. A firm is technically efficient if it is able to obtain maximum output from a given set of inputs(output-oriented measures) or is capable of using a minimal input mix to produce the same level of output (input-oriented measures). A firm is a locative efficient if it employs factors of production up to the point where the marginal rate of technical substitution between any two of its inputs equals the ratio of corresponding input prices [6].
Hence, majority of the efficiency studies have been motivated by the desire to estimate the frontier production function and to measure economic efficiency by using either parametric or nonparametric frontier methods [7]. Therefore, parametric methods involving the stochastic frontier production function, whereas; the nonparametric methods involving the data envelopment analysis [2]. An econometric model is termed as “parametric” if all of its parameters are in finite dimensional parameter spaces; a model is “nonparametric” if all of its parameters are in infinite-dimensional parameter spaces [11]. Methods of frontier analysis may be divided into two groups: parametric (Stochastic Frontier Approach (SFA), Distribution-Free Approach (DFA), Thick Frontier Approach (TFA)) and non-parametric (Data Envelopment Analysis (DEA), Free Disposal Hull (FDH)) methods [7].
The nonparametric method is a method of using linear programming to measure the relative efficiency of a number of decision- making units through the identification of the optimal mix of inputs and outputs which are grouped based on their actual performance [12,13]. It is also a non-parametric method of measuring the efficiency of a decision making unit with multiple inputs and outputs [12]. Therefore, DEA can be defined as the ratio of the weighted sum of outputs to its weighted sum of inputs (Equation vi). On the other hand, SFA, DFA and TFA (Thick Frontier Approach) the production function is defined by the set of explanatory variables (inputs, outputs and other possible explanatory variables) and the two components of this regression´s composite error term (the random error) and the inefficiency term (Equation 1-5).
Types and Natures of Parametric Methods of Efficiency Analysis
The parametric technique can be further divided into three distinct approaches, which all require a particular functional form to be specified for the cost or profit frontier. They are the stochastic frontier approach (SFA), the Thick Frontier Approach (TFA), and the Distribution Free Approach (DFA) [6,14]. In accordance with parametric approaches, the efficiency frontier is constructed on the basis of econometric modelling, usually in the form of Cobb-Douglas (log-linear) production function [11]. Therefore, the production function is defined by the set of explanatory variables (inputs, outputs and other possible explanatory variables) and the two components of this regression´s composite error term (the random error) and the inefficiency term. The stochastic frontier approach treats deviations from production function as comprising both random error (noise) and inefficiency [10,14]. Therefore, SFA assumes two-sided distribution (usually normal with zero mean) of the error term and one-sided distribution of the non-negative inefficiency term [14].
DFA, used in panel data, relaxes composite error term of distributional assumptions. The core inefficiency is distinguished from random error by the assumption of core inefficiency being persistent over time, while random errors tend to average out over time (Equation 4). TFA also does not impose distributional restrictions on the composite error term but assumes that inefficiency term is different in the highest (thick frontier) and lowest efficiency quartile of the observed decision making units and the random error is present within these quartiles [14]. All these approaches commonly suffer from potential specification errors, because the specified cost or profit function is at best an approximation to the true (but unknown) counterpart [6,14].
Types and Natures of Nonparametric Methods of Efficiency Analysis
Under nonparametric methods of efficiency, there are two approaches namely; Data Envelopment Analysis (DEA) and Free Disposal Hull (FDH) methods [11]. However, in the field of research the most commonly practiced approach is data envelopment analysis. As an original non-parametric approach of efficiency measurement, data envelopment analysis has been introduced by Charnes [15], Cooper and Rhodes (CCR) in 1978 [11]. It was originally developed to measure the performance of various non profit organizations, such as educational and medical institutions, which were highly resistant to traditional performance measurement techniques due to the complex and often unknown relations of multiple inputs and outputs and non-comparable factors that had to be taken into account [13].
In addition, DEA was first developed in public sector analysis of technical efficiency, where price information is not available or nor reliable [16]. Moreover Kuosmanen et al. [1] argued that public providers have objectives and constraints different from those of private providers and so the only common ground on which to compare their performance is on the basis of their technical effi ciency. However; in recent years, DEA has been successfully applied in measuring the efficiency of both profit and non-profit organizations, such as the effectiveness of regional development policies [13]. In contrast to the econometric approaches, non-parametric methods are based on the hypothesis that the efficiency frontier is generated from the empirical results’ of the most efficient decision making unit (DMU’s) or from the benchmarks [11]. Nonparametric inference has gained popularity because of several reasons:
a. The computations are easy to estimate.
b. The data need not be measured quantitatively but could be in a qualitative format.
c. The data could also be in an ordinal ranking.
d. Does not have as many restrictive assumptions as parametric statistical inference.
On the other hand, nonparametric inference is deficient in the sense that it does not utilize all the information in the sample and, thus, will be less efficient than parametric inference [17]. Since the DEA model is non-stochastic, noise is reported as inefficiency and makes the mean technical efficiency lower [17].
Advantage Parametric Methods of Efficiency Analysis
Parametric methods of efficiency analysis have significant advantages by providing the possibilities to use panel data, to distinguish the random noise from inefficiency and to calculate the standard error of efficiency measurement results [11]. In addition, the primary advantage of the parametric methods of SFA, DFA and TFA lies in their ability to allow for random error in efficiency estimation [6]. Similarly, this approach is a flexible technique in measuring the frontier production function, which provides for a meaningful estimate of the measurement error [17]. Therefore, parametric methods of efficiency have the benefit of modeling inefficiency and noise [1]. The SFA method is preferable when certain classical assumptions are satisfied regarding the composite error terms, including the contributions from the inefficiency distribution and measurement errors [8].
In addition, this method of efficiency analysis is useful to measure quantitatively independent of the effect of other exogenous factors such as market prices, through exploiting a programming or econometric method to control for the effects [6]. Moreover, Ajibefun [2] reported that parametric frontier analysis allows the test of hypothesis concerning the goodness of fit of the model. On the other hand, parametric frontier functions require the definition of a specific functional form for the technology and for the inefficiency error term [4].
Disadvantage Parametric Methods of Efficiency Analysis
The major disadvantage of these methods of efficiency analysis is that it requires specification of the technology, which may be restrictive in most cases [2]. In addition, conducting the parametric approaches is how to appropriately distinguish random noise from true in efficiency, as neither of them is observable [6]. The functional form requirement causes both specification and estimation problems [4].
Furthermore; parametric method of efficiency analysis doesn’t impose axiomatic properties in the estimate the frontier [1]. In SFA studies, an assumption regarding to a specific functional form of stochastic frontier is required a priori and wrong choice of production function may influence the results. Moreover, the maximum likelihood does not allow assessing the reliability of inferences in small samples. Therefore, SFA requires using of large number of DMUs [10].
Advantages of Nonparametric Methods of Efficiency Analysis
Due to their numerous advantages, nonparametric methods of efficiency analysis have been constantly applied to the agricultural sector [3]. As a result, nonparametric method has attracted the attention of a number of researchers because of its unique ability to measure the efficiency of multiple-input and multiple-output of DMUs without assigning prior weight to the input and output [18]. The nonparametric approach has the advantage of imposing no a priori parametric restrictions on the underlying technology [19]. In this context, DEA is an effective non-parametric method for evaluating the relative efficiency of the decision-making units, which does not need the exact functional form between inputs and outputs approach [2-4]. The nonparametric method of efficiency has the potential to impose axiomatic properties and estimate the frontier non-parametrically [1].
In addition, this method of efficiency analysis used to overcome some disadvantages of the parametric methods of efficiency analysis. The model measures the efficiency of all DMUs without requiring prior weights for the inputs and outputs. The concept of their model relies on assigning virtual weights to inputs and outputs and applies linear programming to ascertain the maximum efficiency of the DMU under assessment [18]. Therefore, DEA calculations are designed to maximize the relative efficiency score of each unit, subject to the constraint that the set of weights obtained in this manner for each DMU must also be feasible for all the others included in the sample [4].
Moreover, nonparametric inference has gained popularity because of several reasons:
a. The computations are easy to estimate.
b. The data need not be measured quantitatively but could be in a qualitative format.
c. The data could also be in an ordinal ranking.
d. Does not have as many restrictive assumptions as parametric statistical inference.
Disadvantage Nonparametric Methods of Efficiency Analysis
Besides their benefits, nonparametric methods of efficiency analysis also have some draw backs. The first one is this approach does not have a solid statistical foundation behind it and is sensitive to outliers [19]. In addition, nonparametric efficiency, represented by conventional performance ratios is influenced by input and output prices, firm sizes and other exogenous factors, which restrain the ratios from reaching closer estimates of the managers’ true performance [6]. It does not also assume any particular functional form for the frontier or the distribution of inefficiency [1]. Therefore, does not allow for random error due to, for example, measurement error, good or bad luck, miss-specifying inputs and outputs, weather, strikes and the like. Similarly, a study by Toma P et al. [3] also reported that non-parametric methods of efficiency analysis do not take into account the uncertainty characterizing the real world (so-called stochastic error).
A study by Kuosmanen et al. [1] and Murillo Zamorano & Vega Cervera [4] also asserted that nonparametric methods of efficiency analysis estimator of model is based on the assumption of no noise (i.e., vi=0 for all firms i). Thus, any deviation from the frontier is forced to be attributed to inefficiency (Wang & Wang, 2002). Because of nonparametric methods does not distinguish between inefficiency and statistical noise effects [4], the full distance of a brand to the efficiency frontier is interpreted as inefficiency. Similarly, since the nonparametric model is non-stochastic, noise is reported as inefficiency, hence a lower mean technical efficiency [17]. But a measurement error or other noise and outliers may influence the shape and position of the frontier [10].
According to Ajibefun [2] nonparametric methods couldn’t estimate parameters for the model and hence impossible to test hypothesis concerning the performance of the model. Similarly, a study by Porcelli [16] confirmed that nonparametric efficiency analysis does not allow for measurement errors and confidence intervals [3] hence, it lacks statistical inference. Moreover, nonparametric methods of efficiency are non-stochastic; consequently, efficiency scores are contaminated by omitted variables, measurement error, and other sources of statistical noise [16]. Furthermore, nonparametric statistical inference often assumes no knowledge about the distribution of the underlying population. Therefore, nonparametric inference has deficiency in the sense that it does not utilize all the information in the sample
The Choice Between Parametric and Nonparametric Methods
Unfortunately, there is no commonly accepted methodology of efficiency analysis currently, but the field is divided between two competing approaches: Data Envelopment Analysis (DEA) and Stochastic Frontier Analysis (SFA) [1]. The choice of estimation method has been an issue of debate, with some researchers preferring the parametric and others prefer the nonparametric approach [7]. In addition, parametric and nonparametric techniques are the two approaches that have been used to obtain estimates of efficiencies but the choice of which approaches to use is still unclear [19]. Since both parametric and non-parametric techniques have their own merits, the selection of a suitable estimation method has been quite controversial. Furthermore, the choice of methodology appears to influence the policy implications derived from the analyses [6].
In contrary, Toma P et al. [3] Reported that the two approaches of efficiency measures (parametric and non-parametric) methods achieve highly correlated results in most cases. In addition, studies on efficiency measurements argue that a researcher can safely choose any of the methods since there are no significant differences between the estimated results [8,19]. Generally, the parametric technique is likely to be more attractive than DEA in cases where the data suffer from serious measurement errors, random events and difficulty in identifying inputs and outputs. On the other way, DEA may be a better choice when random disturbances are less of an issue, and price information is not available [6].
Consistency between Parametric and Nonparametric Measures
A study by Wang W [6], reveal that the choice among the various frontier methods has no important effect on the estimated EE scores. This evidence suggests that the two models tend to reach moderately consistent rankings with each other once the true structure of pooling data is omitted. As nonparametric measures of performance (efficiency) are widely used by managers and policymakers, it is informative to correlate the frontier efficiency scores with some conventional performance measures commonly used in the financial industry [6].
The parametric methods SFA and DFA seem to perform relatively consistently with conventional performance measures. In some cases, parametric approaches were found to be more stable than the nonparametric ones [6]. This is perhaps because the nonparametric method tends to confound random disturbances with inefficiency due to its non-stochastic nature, and the SFA and DFA have to specify a particular functional form for estimation, which may be miss-specified [6].
Methods and Procedures for Parametric and Nonparametric Methods
The parametric approach
Parametric efficiency analysis is one of the most investigated area sin applied production economics [5]. The measurement of productive efficiency by means of parametric techniques requires the specification of a particular frontier function [4,10]. In addition, parametric statistical inference is generally based on the assumption that the random samples are selected from some underlying (e.g., normal) distribution [17]. Stochastic frontiers are commonly used in parametric methods and estimated by the Maximum Likelihood (ML) estimator [14].
Therefore, parametric models postulate a priori a specific functional form (e.g., Cobb-Douglas, translog, etc.) and subsequently estimate its unknown parameters [1]. The stochastic frontier models capture the effects of exogenous shocks beyond the control of the analyzed units. Errors in the observations and in the measurement of output are also taken into account in this kind of models [7]. Parametric statistical inference is generally based on the assumption that the random samples are selected from some underlying (e.g., normal) distribution [17]. Therefore, most of parametric statistical tests are reliable even if there are slight departures from normality, as long as sample sizes are large [17].
Stochastic frontier model specifications: Theory usually presents the producers as successful optimizers by maximizing production, minimizing cost, and maximizing profits. Econometric techniques build on the basis to estimate production/cost/profit function parameters using regression techniques where deviations of observed choices from optimal ones are modelled as statistical noise [20]. Therefore, econometric estimation techniques should allow for the fact that deviations of observed choices from optimal ones are due to two factors: by either failure to optimize i.e., inefficiency or due to random shocks. According to Anonymous [21] and Mastromarco [22], the econometric approach to estimate frontier models uses a parametric representation of technology along with a two-part composed error term. According to Sharma et al. [23] and Wongnaa & Awunyo Vitor [24] the firm’s technology is represented by a stochastic production frontier as follows:

Where Yi denotes output of the ith firm; Xi is a vector of functions of actual input quantities used by the ith firm; β is a vector of parameters to be estimated; and εi is the composite error term defined as:
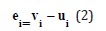
where vi is assumed to be independently and identically distributed random errors, independent of the ui; and the ui is nonnegative random variables, associated with technical inefficiency in production, which are assumed to be independently and identically distributed with mean, μ, and variance, δ2u (|Nμ, δ2u|).
Based on the nature of data (cross sectional, panel and time invariant), the stochastic frontier model has a certain difference as shown below. In case of cross-section stochastic frontier model (equation 3) the time dimension of the inefficiency term, u, will be kept constant over time. Whereas, for panel data stochastic frontier model (equation 4) time dimension of the inefficiency term, u, will be allowed to change over time. On the other hand, for time-invariant inefficiency data type (equation 5), inefficiency component of the error term, u, is time-invariant.
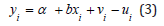


Where, y is the observed outcome (goal attainment), β′x + v is the optimal, frontier goal (e.g., Maximal production output or minimum cost) pursued by the individual, β′x is the deterministic part of the frontier and v~N [0, σv2] is randomness or statistical noise and it is assumed to be normally distributed with zero mean [4]. On the other hand, the amount by which the observed individual fails to reach the optimum (the frontier) is u, in this context, u is the “inefficiency.” Moreover, u represents the proportion by which y falls short of the goal, and has a natural interpretation as proportional or percentage inefficiency.
So, u=|U| and U~N [0, σu2]. Therefore, the economic logic behind this specification is that the production process is subject to two economically distinguishable random disturbances: statistical noise represented by viand technical inefficiency represented by ui. The component ui is assumed to be distributed independently of viand to satisfy ui≥0. The non-negativity of the technical inefficiency term reflects the fact that if ui>0 the country will not produce at the maximum attainable level.
The non-parametric approach
DEA is a widely nonparametric and powerful data analytic tool, which is commonly applied in the research and practitioner communities to determine the relative efficiencies of the DMU [25]. Non-parametric methodology has been applied, using the concept of a reference group of efficient decision-making units that produce a similar output (peer group) [3]. According to Toma P et al. [3] the most efficient DMUs are those situated on the frontier, the others can reach this allocation if: they reduce the inputs, while maintaining a constant output; they increase the outputs, while maintaining the inputs constant; they perform a combination of the two previous solutions [3]. The distance between each DMU and its related best point is a measure of the inefficiency, that is, how much it is possible to expand the output given the input or how much it is possible to reduce the input given the output.
In DEA, we use the concept of “reference set”, which is useful to identify the best production unit with which to compare all the other observations. The DEA method is applied by adopting two different approaches that are both based on the concept of technical efficiency, defined as the ability of the DMU (the decision-making unit of production), given the existing technology, to produce the highest level of outputs from a given combination of inputs (output model- oriented), or alternatively, to use the least possible amount of inputs to obtain a given output (model input-oriented). Therefore, this nonparametric methodology provides guidance on how the inefficient production units could become efficient, using the concept of reference group of efficient decision making units that produce a similar output (peer group) [3].
The basic efficiency measure utilized in DEA is the ratio of output to input, but this measure is only applicable to cases of a single input and output. This analysis requires two-dimensional data where all DMUs are plotted on a two-axis graph and an efficient frontier constructed. All units that lie on the efficient frontier are defined as efficient units (i.e., they have a 100% efficiency score), while all those that do not lie on the frontier are defined as inefficient units. Their locations from the efficient frontier are then used to calculate their efficiency scores. The frontier thus ‘‘envelops” the whole data [18]. In the case of multiple input and/or multiple out put DEA uses linear programming to construct a non-parametric piece-wise surface (or frontier) over the data, so as to be able to calculate efficiencies without parameterizing the technology [16]. Therefore; DEA calculations are designed to maximize the relative efficiency score of each unit, subject to the constraint that the set of weights obtained in this manner for each DMU must also be feasible for all the others included in the sample [4].
The x-axis measures the input quantity and the y-axis the output quantity. Each point represents the input-output combination of each producer. DEA will envelop all these points in order to compute a piece-wise frontier over them, then the efficiency score of each producer depends on the distance from the frontier. DEA constructs a piecewise linear convex frontier connecting the set of best practice observations. It envelopes input and output data, relative to which costs are minimized or profit/revenue is maximized. Efficiency scores are then calculated from the frontiers generated by a sequence of linear programs. These fractional programs are defined by external optimization of the ratio of weighted sum of outputs to weighted multiple input, subject to the constraints of non-decreasing weights and efficiency measure less than or equal to one [14]. Efficiency measures can be calculated relatively to the efficient technology, represented by a form of frontier function. Then, inefficiency is the distance of the other observations from this best-practice realization [11].
Nonparametric Model Specifications
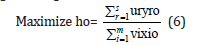
The DEA method allows for the calculation of the relative efficiency of the data, and does not provide any information on the absolute efficiency. The most efficient DMUs are those situated on the frontier, the others can reach this allocation if: They reduce the inputs, while maintaining a constant output; they increase the outputs, while maintaining the inputs constant; and they perform a combination of the two previous solutions [3]. According to Vincová [26] in nonparametric models, we evaluate n productive units, DMUs, where each DMU takes m different inputs to produce s different outputs. Our proposed measure of the efficiency of any UMU is obtained as the maximum of a ratio of weighted outputs to weighted inputs subject to the condition that the similar ratios for every DMU be less than or equal to unity [15]. The models must include all characteristics considered, i.e. the weights of all inputs and outputs must be greater than zero. Such a model is defined as a linear divisive programming model:
Subject to:
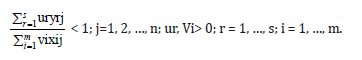
Here the yrj, xij (all positive) are the known outputs and inputs attached to each jth DMU and the ur, vi> 0 are the variable weights to be determined by the solution of this problem e.g., by the data on all of the DMU’s which are being used as a reference set. According to [4], a unit will be efficient if and only if this ratio equals one, otherwise it will be considered as relatively inefficient.
Summary and Conclusion
In summary, under parametric methods of efficiency analysis there are three approaches, namely; Stochastic Frontier Approach (SFA), Distribution-Free Approach (DFA), and thick frontier approach, (TFA). On the other hand, nonparametric methods of efficiency analysis have two main approaches namely; Data Envelopment Analysis (DEA), Free Disposal Hull (FDH) methods. Therefore, these two approaches have been used to obtain estimates of farm efficiencies. Both parametric and nonparametric methods of efficiency analysis have their own advantage and disadvantage. For instance, nonparametric techniques make no accommodation for noise. Parametric method on the other hand, requires specification of the technology, which may be restrictive in most cases. DEA does not model noise, but is able to impose axiomatic properties and estimate the frontier non-parametrically, while SFA cannot impose axiomatic properties, but has the benefit of modeling inefficiency and noise [1].
Based on the robustness of different techniques in ranking productive units, DEA can improve the accuracy of parametric techniques. The flexibility of DEA permits the introduction of relevant issues such as non-discretionary variables, categorical variables, or constrained multipliers [4]. In terms of consistency, the parametric approaches were found to be more stable than the non-parametric ones. This is perhaps because the DEA tends to confound random disturbances with inefficiency due to its non-stochastic nature. On the other hand, this nonparametric methodology provides guidance on how the inefficient production units could become efficient, using the concept of reference group of efficient decision-making units that produce a similar output.
Since both parametric and non-parametric techniques have their own merits and demerits, the selection of a suitable estimation method has been quite controversial and still unclear. Therefore, a parametric and nonparametric method of efficiency analysis is not direct competitors but rather complements: in the trade off between DEA and SFA something is sacrificed for something to bargain. Hence, joint use of parametric and non-parametric measurement techniques of efficiency is a novel issue in the recent empirical literature.
Recommendations
The problems of DEA models can be solved either by collecting or by measuring accurately all relevant variables. Another and more feasible alternative for including statistical noise in the model is to use a parametric approach for the estimation of the production function. In order to overcome the limitation of the construction of confidence intervals, using a bootstrap DEA method allows us to validate the results and enables us to obtain confidence intervals and adjusted efficiency scores.
References
- Kuosmanen T, Johnson A, Saastamoinen A (2014) Stochastic nonparametric approach to efficiency analysis : A unified framework. In: Zhu J (Ed.), Handbook on data envelopment analysis, Springer, New York, USA, pp. 1-49.
- Ajibefun IA (2008) An evaluation of parametric and non-parametric methods of technical efficiency measurement : Application to small scale food crop production in Nigeria. Journal of Agriculture & Social Sciences 4(3): 95-100.
- Toma P, Paolo P, Zurlini G, Valente D, Petrosillo I (2017) A non-parametric bootstrap-data envelopment analysis approach for environmental policy planning and management of agricultural efficiency in EU countries. Ecological Indicators 83: 132-143.
- Murillo Zamorano LR, Vega Cervera JA (2001) The use of parametric and non-parametric frontier methods to measure the productive sciences in the industrial sector : A comparative study. International Journal of Production Economics 69(3): 265-275.
- Sauer J (2006) Economic theory and econometric practice : Parametric efficiency analysis. Empirical Economics 31(4): 1061-1087.
- Wang M, Wang MH (2002) Comparison of economic efficiency estimation methods : Parametric and non-parametric techniques. The Manchester School 70(5): 682-709.
- Murillo Zamorano LR (2004) Economic efficiency and frontier techniques. Journal of Economic Surveys 18(1): 33-77.
- Oh SC, Hildreth AJ (2016) Energy performance analysis : Stochastic Frontier Analysis (SFA) and Data Envelopment Analysis (DES) for energy performance analysis, in analytics for smart energy management. Springer International Publishing, Switzerland, pp. 29-77.
- Daraio C, Simar L (1993) The measurement of efficiency, in advanced robust and nonparametric methods in efficiency analysis: Methodology and applications, pp. 13-42.
- Bezat A (2009) Comparison of the deterministic and stochastic approaches for estimating technical efficiency on the example of nonparametric DEA and parametric SFA methods. Metody Ilościowe w Badaniach Ekonomicznych 10(1): 20-29.
- Arshinova T (2007) The problem of efficiency measurement and its solutions. Riga Technical University, Latvia, p.97.
- Alrafadi KMS, Yusuf M, Hisham B (2016) Measuring efficiency in banks : A brief survey on nonparametric technique (Data Envelopment Analysis). International Journal of Business, Economics and Management 3(5): 52- 68.
- Roman M, Gotiu L (2017) Non-parametric methods applied in the efficiency analysis of European structural funding in Romania. MPRA 18(2): 80548.
- Iršová Z, Havránek T (2010) Measuring bank efficiency: A metaregression analysis. Prague Economic Papers 4: 307-328.
- Charnes A, Cooper WW, Rhodes E (1978) Measuring the efficiency of decision making units. European Journal of Operational Research 2(6): 429-444.
- Porcelli F (2009) Measurement of technical efficiency: A brief survey on parametric and non-parametric techniques, Measurement of Technical Efficiency, pp. 1-27.
- Gempesaw CM (1992) Nonparametric analysis of production efficiency : Discussion. NJARE 21(2): 121-124.
- Aldamak A, Zolfaghari S (2017) Review of efficiency ranking methods in data envelopment analysis. Measurement 106: 161-172.
- Ahmed MH (2015) Measuring technical, economic and Allocative efficiency of maize production in subsistence farming : Evidence from the central rift valley of Ethiopia. Applied Studies in Agribusiness and Commerce 9(3): 63-74.
- Furková A (2013) Methodology and applications of stochastic frontier analysis, pp. 1-30.
- Anonymous (1977) Stochastic Frontier Models and Efficiency Analysis, pp. 1-143.
- Mastromarco C (2008) Stochastic frontier models.
- Sharma KR, Leung P, Zaleski HM (1999) Technical, allocative and economic efficiencies in swine production in Hawaii : A comparison of parametric and nonparametric approaches. Agricultural Economics 20(1): 23-35.
- Wongnaa CA, Awunyovitor D (2017) Scale efficiency of maize farmers in four agro ecological zones of Ghana : A parametric approach. Journal of the Saudi Society of Agricultural Sciences.
- Omar MAE (2014) Technical and economic efficiency for broiler farms in Egypt. Application of Data Envelopment Analysis (DEA). Global Veterinaria 12(5): 588-593.
- Vincová IK (2005) Using DEA models to measure efficiency. Biatec 8: 24- 28.
© 2018 Erkie Asmare. This is an open access article distributed under the terms of the Creative Commons Attribution License , which permits unrestricted use, distribution, and build upon your work non-commercially.
Editor In Chief


.jpg)


Signup for Newsletter

Quick Links
 Editorial Board Registrations
 Submit your Article
 Refer a Friend
 Advertise With Us
Our Recent Edition

.jpg)


Top Editors


.jpg)


.bmp)
.jpg)
.png)
.jpg)


.png)

.png)


.png)


Financial Support

Sponsors

Latest e-Books

Latest Video

 a Creative Commons Attribution 4.0 International License. Based on a work at www.crimsonpublishers.com.
Best viewed in
a Creative Commons Attribution 4.0 International License. Based on a work at www.crimsonpublishers.com.
Best viewed in