- Submissions

Full Text
Open Access Biostatistics & Bioinformatic
Untargeted UPLC-MS Downstream Data Processing and Statistical Analysis - Illustrated by a Pilot Study on Cognitive Impairment
TANG Xingyu1*, KOH Woon-Puay1 and NG Sean Pin1*
1Singapore Phenome Centre, Lee Kong Chian School of Medicine, Nanyang Technological University, Singapore
2Health Services and Systems Research, Duke-NUS Medical School Singapore, Singapore
*Corresponding author: NG Sean Pin, TANG Xingyu, Singapore Phenome Centre, Lee Kong Chian School of Medicine, Nanyang Technological University, Singapore
Submission: June 26, 2018;Published: July 25, 2018

ISSN: 2578-0247
Volume2 Issue2
Abstract
This article is to introduce the procedure of untargeted ultra-performance liquid chromatography-mass spectrometry(UPLC-MS) downstream data processing and statistica
Keywords: Feature filtration; Normalization; OPLS-DA; PCA; Quality control; Untargeted UPLC-MS
Introduction
Study overview
The present analysis utilized baseline data and bio-specimens from 99 cases with cognitive impairment and 99 age-and-sex matched controls nested within the prospective Singapore Chinese Health Study cohort [1]. Participants were recruited and interviewed for lifestyle and habitual dietary intake from 1993- 1998, and gave blood for research from 1999-2004, at a mean age of 63.6 (range 50.5-74.1) years. Cognitive function was measured using a 30-item modified Singapore version of the Mini-Mental State Examination (MMSE) from 2014-2016, after average 13.8 (range 10.4-20.2) years of follow-up. Participants were at a mean age of 77.5 (66.0-88.3) years at the time of cognitive assessment, and cases of cognitive impairment were identified using educationadjusted cut-offs of the MMSE scores (MMSE.edu) [2].
Data generation
The plasma samples collected from these 198 individuals underwent a lipid profiling analysis performed on ACQUITY UPLC/ Xevo G2-XS QToF (Waters, Manchester, UK) and equipped with an electrospray source operating at either positive (ESI+) or negative (ESI-) ionization mode. The liquid chromatography (LC) stage of the experiment performed a physical separation of compounds in the samples, followed by the mass spectrometry (MS) stage which measured the mass of charged particles (i.e. ions). Therefore, an MS feature was characterised by a combination of a retention time (RT) and a mass-to-charge ratio (m/z). Raw MS data were preprocessed using Progenesis QI (Nonlinear Dynamics, Newcastle, UK), including automatic alignment for RT, peak picking, and deconvolution that groups ions into compounds. Abundance data for all injections were exported for downstream data processing and statistical analysis. Data processing and statistical analysis procedures performed in SPC are described with details in Section 2 and 3 of this article respectively. Section 4 discusses the study as well as some related/future works, followed by the conclusions presented in Section 5.
Data Processing
Feature filtration
Multiple criteria are employed to identify and remove unreliable MS features (noises) from the dataset [3]. Prior to UPLCMS experiment, equal aliquots of the study samples are pooled to form the quality control (QC) sample. During the experiment, the QC sample is injected after every 5 or 10 injections of study samples, as well as at the start and the end of the analysis run. This is to monitor instrument stability and analytic reproducibility. The abundance variation among QC series is one of the key criteria in feature filtration. Also, during the UPLC-MS experiment, after the analysis run, a sequence of diluted QC (dQC) samples with known dilution factors are injected. The abundance correlation to dilution factors among dQC series is another key criterion in feature filtration, since features which do not respond to dilutions are much likely to be background noises. In this pilot study, the ESI+ and ESI- modes initially generate 8887 and 4806 MS features respectively. After the multiple-criteria filtration, there are 3020 (34%) and 818 (17%) of them remaining in the datasets.
Data normalization
After feature filtration, data normalization is employed to further correct the dataset for potential noises. Probabilistic quotient normalization (PQN) [4] accounts for potentially different dilutions of samples, by scaling the spectra to a same virtual overall concentration, which is generic and widely applied in Metabolomics studies. Locally weighted scatterplot smoothing (LOESS) [5] normalization corrects for variability in feature abundances related to injection order, due to for example, possible drift of detector sensitivity over time. LOESS normalization is less generic as relying on the QC series but is powerful in correction of abundances for injection order, which is commonly needed in studies with relatively large sample sizes [6].
Statistical Analysis
Normalized abundance data of the MS features having passed the filtrations, for all study samples as well as the QC injections are inputted to statistical analysis.
Unsupervised analysis
Unsupervised analysis is to identify major sources of variations in a high-dimensional dataset, and a typical approach is the principal component analysis (PCA). In preparation for PCA, normalized abundances are log-transformed for better normality in distributions. Thereafter, data are mean-centred and Paretoscaled, which is a compromise between the conventional autoscaling and no scaling at all, prior to PCA. PCA converts possibly correlated features into orthogonal components, which are sorted by the variances explained by them, making it easier to reduce dimensionality as well as to visualize the dataset. Moreover, the positions of QC series in the PCA score plot help monitoring the instrument stability and analytic reproducibility.
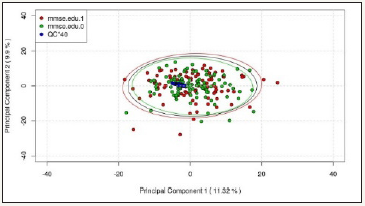
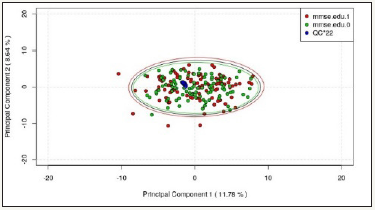
In this pilot study, the first two principal components explain 11.32% and 9.90% of the total variance of the data respectively for ESI+ mode, while those for ESI- mode explain 11.78% and 8.64% respectively. From the score plots (Figure 1 & 2), it is observed that:
Figure 1: ESI+ PCA Score Plot (First 2 Components).

1. QC series are clustered together on the plot, showing good stability and reproducibility in the UPLC-MS experiment.
2. Major variations in the data are not correlated with the study outcome (MMSE.edu).
Figure 2: ESI- PCA Score Plot (First 2 Components).

Supervised analysis
Supervised analysis is to maximize separation between groups of study subjects in correspondence to the study outcome of interest. Orthogonal partial least squares (OPLS) [7] and OPLSdiscriminate analysis (DA) [8] remove variation in data that is perpendicular to the study outcome and thereafter calculate components which are predictive for the outcome. In each OPLS(- DA) model, a R2 value and a Q2 value are obtained to measure the model fit and the model predictability, respectively. To validate the model, a random permutation strategy is employed where the study outcome is randomly shuffled and a new OPLS (-DA) model is built. 100 independent permutations are calculated, and the p-values testing whether the R2 and Q2 values of the actual model are higher than those of a random model are used to evaluate model validity.
In this pilot study, for ESI+ mode, we get R2 = 0.308 with p-value = 0.034, and Q2 = -0.180 with p-value = 0.219. For ESI- mode, we get R2 = 0.380 with p-value = 0.002, and Q2 = -0.128 with p-value = 0.092. These statistics indicate that the resulting model fit is moderate, but model predictability is poor, implying that the model built might not be reliable.
Discussion
In this pilot study, we were not able to obtain any conclusive results, and this could be due to the following limitations of the study:
1. Plasma samples were collected at least 10 years before the MMSE tests were carried out. This can make the “signal” that we are looking for, i.e. differential metabolic profiles between cases and controls, too weak to be observed.
2. The role of MMSE is still controversial as a stand-alone single-administration test in the identification of mild cognitive impairment patients who could develop dementia [9].
3. The association between cognitive impairment and plasma metabolite profile can be expected to be confounded by many dietary, lifestyle and comorbidity factors. In a substudy where we excluded all subjects with anyone of four major confounding diseases, namely hypertension, heart attack, stroke, and diabetes, the results improved but were still not conclusive due to reduced sample size.
Due to the limitations of observational epidemiologic studies, more quantitative approaches may be more promising to achieve conclusive results. Targeted MS experiment focuses on quantitative analysis of pre-specified metabolites, and recent works have shown improvement of ability in terms of the amount of compounds measured in a single run [10]. The technique of Nuclear Magnetic Resonance (NMR) is also gaining popularity in modern molecular epidemiology studies owning to its high reproducibility as well as quantitative accuracy [11].
Conclusion
The procedures of untargeted UPLC-MS downstream data processing and statistical analysis, performed in SPC, are described in this article, illustrated by a pilot study on cognitive impairment. SPC is consistently making efforts to optimize these procedures based on experience gained from various studies, as well as the latest literatures.
Programming
The procedures of data processing and statistical analysis are all implemented using R v3.4.1 (R Core Team) and RStudio v1.0.153 ( RStudio , Inc.) in SPC.
Acknowledgment
This work was supported by the Singapore National Medical Research Council (NMRC/CSA/0055/2013) and the United States National Institutes of Health (UM1 CA182876 and R01 CA144034). The SPC team supported this study in conducting the UPLC-MS experiment, authoring the use of data and providing valuable comments and suggestions.
References
- Hankin JH, Stram DO, Arakawa K, Park S, Low SH, et al. (2001) Singapore chinese health study: development, validation, and calibration of the quantitative food frequency questionnaire. Nutr Cancer 39(2): 187-195.
- Katzman R, Zhang M, Wang Z, Liu WT, Yu E, et al. (1988) A chinese version of the mini-mental state examination; impact of illiteracy in a Shanghai dementia survey. J Clin epidemiol 41(10): 971-978.
- Tam Z, Ng S, Tan L, Lin CH, Rothenbacher D, et al. (2017) Metabolite profiling in identifying metabolic biomarkers in older people with lateonset type 2 diabetes mellitus. Scientific report 7(1): 4392
- Dieterle F, Ross A, Schlotterbeck G, Senn H (2006) Probabilistic quotient normalization as robust method to account for dilution of complex biological mixtures. Application in 1H NMR metabonomics. Anal Chem 78(13): 4281-4290.
- Cleveland WS (1979) Robust locally weighted regression and smoothing scatterplots. Journal of the American statistical association 74(368): 829-836.
- Dunn WB, Broadhurst D, Begley P, Zelena E, Francis MS, et al. (2011) Procedures for large-scale metabolic profiling of serum and plasma using gas chromatography and liquid chromatography coupled to mass spectrometry. Nat Protoc6(7): 1060-1083.
- Trygg J,Wold S (2002) Orthogonal projections to latent structures (O-PLS). Journal of chemometrics 16(3): 119-128.
- Bylesjo M, Rantalainen M, Cloarec O, Nicholson JK, Holmes E, et al. (2006) OPLS discriminant analysis: combining the strengths of PLS-DA and SIMCA classification. Journal of Chemometrics 20(8-10): 341-351.
- Arevalo RI, Smailagic N, Figuls IM, Ciapponi A, Sanchez PE, et al. (2015) Mini-Mental Staet Examination (MMSE) for the detection of Alzheimer’s disease and other dementias in people with mild cognitive impairment (MCI). Cochrane Database Syst Rev (3):CD010783.
- Wang J, Zhou L, Lei H, Hao F, Liu X, et al. (2017) Simultaneous quantification of amino metabolites in multiple metabolic pathways using ultra-high performance liquid chromatography with tandem-mass spectrometry. Scientific reports 7(1): 1423.
- Karaman I, Ferreira DL, Boulange CL, Kaluarachchi MR, Herrington D, et al. (2016) Workflow for integrated processing of multicohort untargeted 1H NMR metabolomics data in large-scale metabolic epidemiology. J Proteome Res 15(12): 4188-4194.
© 2018 TANG Xingyu. This is an open access article distributed under the terms of the Creative Commons Attribution License , which permits unrestricted use, distribution, and build upon your work non-commercially.
 a Creative Commons Attribution 4.0 International License. Based on a work at www.crimsonpublishers.com.
Best viewed in


.jpg)


 Editorial Board Registrations
 Submit your Article
 Refer a Friend
 Advertise With Us
.jpg)


.jpg)


.bmp)
.jpg)
.png)
.jpg)


.png)

.png)


.png)


