- Submissions

Full Text
Open Access Biostatistics & Bioinformatics
Radial Basis Function Network versus Regression Model in Manufacturing Processes Prediction
Homero De Jesus De Leon Delgado*
University of the Valley of Mexico, Mexico
*Corresponding author: Homero De Jesus De Leon Delgado, University of the Valley of Mexico, Calle Tezcatlipoca 2301, Los Rodriguez, 25204 Saltillo, Coah, Mexico
Submission: February 01, 2018; Published: February 23, 2018

ISSN: 2578-0247Volume1 Issue2
Abstract
One of the objectives of manufacturing industry, is to increase the efficiency in their processes using different methodologies, such as statistical modeling, for production control and decision-making. However, the classical tools sometimes have difficulty to depict the manufacturing processes. This paper is a comparative study between a multiple regression model and a Radial Basis Function Neural Network in terms of the statistical metrics R2 and R2 adj applied in a permanent mold casting process and TIG welding process. Results showed that in both cases, the RBF network performed better than Regression model.
Keywords: Radial basis function; Multiple regression; Process prediction
Introduction
Nowadays, the manufacturing companies have been increased difficulty in their process decision making, due to rapid changes in design methods and demand for quality products [1]. For that reason, there are different tools for modeling a process, like statistical, mathematical and intelligent systems, but the question is which of these tools depict better the process?
The multiple regression is a statistical model that analyze how a set of predictor variables X are related to a single response measured y. Regression analysis answers questions about the dependence of a single response variable on one or more predictors, including prediction of future values, discovering which predictors are important and estimating the impact of changing a predictor or a treatment on the value of the response [2]. The Radial Basis Function (RBF) neural network aids to explain the process outputs based on the inputs assigned to it. For example, to automate a manufacturing process, it is necessary to know the input-output relationship in both directions, and using a radial basis network it is possible to predict the results of a manufacturing process efficiently [3]. The RBF networks are important in prediction by his character of universal approximators [4] and for its good performance in the non-linearity common in processes [5]. In this paper, we propose a comparative study between a multiple regression model and a Radial Basis Function Neural Network in terms of the statistical metrics R2, R2adj, R2PRESS applied in a permanent mold casting process.
Methods
Radial basis function network
Are so called Radial basis functions because the functions of the hidden layer as a base set for the function to be approximated, and the functions display a radial symmetry, being only a function of the distance between the learned patterns and the input ones.
A neural network with radial basis function consists of the following layers [6]:
Input layer: it is formed by the source nodes (sensory units).
Intermediate layer: it is a hidden layer of great dimension and in which the units (neurons) that form it are the base functions for the input data.
Output layer: that has the responsibility in the network for the activation of patterns applied in the input layer.
Radial basis functions are functions that reach a level close to the maximum of their path when the input pattern (Xn) is close to the center of the neuron. If the pattern moves away from the center, the value of the function tends to the minimum value of its path. The training is only forward. The output of a network in general is influenced by a non-linear transformation, originating in the hidden layer through the radial function and a linear one in the output layer through the continuous linear function. A derivation of the radial basis models is the use of the standard deviation to activate the function G(*) , working with exp(d2 / a), where a is the standard deviation for the hidden node.
Genetic algorithm
As mentioned above, the RBF output depends on the distance between the inputs to the network centers. There are many methods of clustering and optimization for determining the centers. One of them is the Genetic Algorithm (GA), which is a method of optimization based on the processes of biological evolution [7]. It is part of intelligent systems.
The process consists in select randomly individuals of the current population; these individuals will be the parents of the next generation that will be evolve to an optimal solution. The GA works on three main rules [8]:
Parent selection of the next generation.
The combination of parents to form the next generation.
Applying random changes of each parent for the children.
The GA considers one function of evaluation (fitness function) to optimize. The objective is maximizing or minimizing such fitness function. Applying GA to determine the centroids of the RBF, the metric used is R^2 which is a global evaluation metric [9], in this case the objective is to maximize this metric.
Multiple regression
A regression model which involves more than one regressor variable is called multiple regression model. In general, you can relate a response Y with k regressors or predictors. The statistical model to explain the behavior of the dependent variable including any number of independent variables is equation (1).
Yi=β0+β1Xi1+β2Xi2+....+βkXik+εi (1)
The deviation of an observation Yi from its population mean E[Yi] is taken into account by adding a random error E[Yi] .There are k independent variables and k+1 parameters to be estimated. Usually, the estimation of the parameters βj is made by means of the Ordinary least Square Method (OLS). In a matrix form, the OLS estimator is given by [9]:
Application
Figure 1: Radial basis function structure.
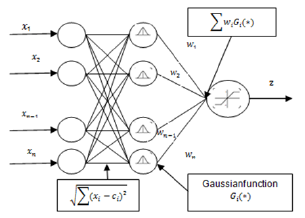
Figure 2: Target vs regression.
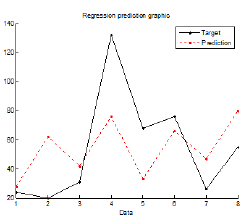
The process consists of a permanent mold casting for manufacturing a piece for the electrical industry. They have three independent variables in eight runs. The data were obtained using a factorial design with 3 factors 2 levels. The objective of the modeling is to find the variable that causes more defects and minimize them. The model response is the total defects in the process. The observations are shown in Table 1. The comparison between the real responses and the Regression model is showed in the Figure 1 and the comparison between Radial Basis Function and real response is showed in the Figure 2 & 3.
Figure 3: Target vs RBF.
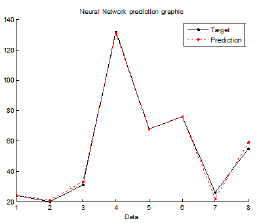
Table 1: Model variables.
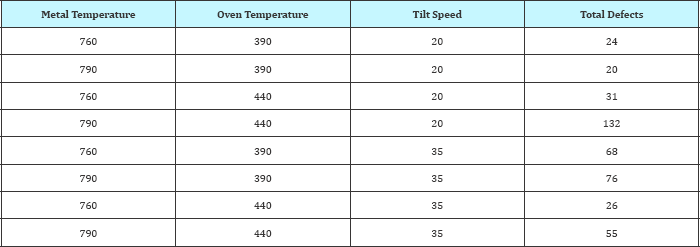
Table 2: Comparison of association measurements.

Table 3: Comparison of association measurements.

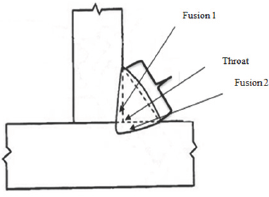
It is possible to see graphically the FBR network model has a better fit than by regression. After that, the measurements of association were estimated to test the performance of a Regression model and RBF. Results are shown in Table 2. It is observed at Table 2, that the RBF Network depicts the process variation over that 90% in terms of the coefficients of determination. The method was applied in the TIG welding process too, using a welding robot Kuka KR-16, with multi-process welding system (MIG and TIG). Then taking process data and identifying the important parameters: feed rate (IPM), input voltage (volts), wire speed (m/min), and the output, the fusion 2 of the welding.
The Figure 4 shows the response called Fusion 2, and measures the penetration of the vertical element to be attached to the horizontal element. This response is important in the material properties since its control depends on the strength of the joint. The Table 3 illustrates the results about the application and comparison between the RBF with Regression model. Those metrics are quantities used to express the proportion of total variability in the response accounted by the model. So that indicates the proportion of variability in yexplained by the model. Then the RBF is better than multivariate regression model.
Figure 4: TIG welding.
Conclusion
In order to improve manufacturing processes, it is very important to analyze the process to take better decisions. In this article it was shown that a tool based alternative intelligent systems, generates a better fit compared to regression analysis in terms of the measures of association. This statistical metrics provide information about the strength of the relationships between predictors and the dependent variable. With these results, it is possible to find the parameters that cause more defects. However, for future work is proposed to consider analyze each defect in a model for joint prediction, considering that the model design must be made multivariate: what will happen with the Regression model and RBF?
References
- Ahilan C, Kumanan S, Sivakumaran N, Edwin J (2013) Modeling and prediction of machining quality in CNC turning process using intelligent hybrid decision making tools. Applied Soft Computing 13(3): 15431551.
- Cevallos J (2008) Redes neuronales de base radial aplicadas a la mejora de la calidad. Industrial Data 11(2): 63-72.
- Weisberg S (2005) Applied linear regression. Wiley series in probability and statistics, John Wiley and Sons, USA, pp. 322-361.
- Broomhead D, Lowe DS (1988) Multi-variable functional interpolation and adaptive networks. Complex Systems 2(3): 321-355.
- Malviya R, Kumar D (2011) Tuning of neural networks using particle swarm optimization to model MIG welding process. Swarm and Evolutionary Computation 1(4): 223-235.
- Haykin S (1999) Neural networks a comprehensive foundation. Pearson Prentice Hall, Patparganj, Delhi, India.
- Holland J (1975) Adaptation in natural and artificial systems. University of Michigan Press, Ann Arbor, USA.
- Goldberg D (1989) Genetic algorithms in search, optimization and machine learning. Addison Wesley Longman Publishing Co, Inc, Boston, USA.
- Montgomery D, Peck E, Vinning G (2006) Introduction al analisis de Regresion Lineal. Mexico, North America.
© 2018 Homero De Jesus De Leon Delgado. This is an open access article distributed under the terms of the Creative Commons Attribution License , which permits unrestricted use, distribution, and build upon your work non-commercially.
 a Creative Commons Attribution 4.0 International License. Based on a work at www.crimsonpublishers.com.
Best viewed in


.jpg)


 Editorial Board Registrations
 Submit your Article
 Refer a Friend
 Advertise With Us
.jpg)


.jpg)


.bmp)
.jpg)
.png)
.jpg)


.png)

.png)


.png)


