- Submissions

Full Text
Open Access Biostatistics & Bioinformatics
Modelling Length of Hospital Stay for Tuberculosis Treated in-Patients at Queen Elizabeth Central Hospital: a Competing Risk Perspective
Halima S Twabi1* and Mavuto Mukaka2,3
1 Mathematical Sciences Department, University of Malawi, Malawi
2 Mahidol-Oxford Tropical Medicine Research Unit, Mahidol University, Thailand
3 Nuffield Department of Medicine Research Building, University of Oxford, UK
*Corresponding author: Halima Twabi, University of Malawi, Chancellor College, PO. Box 280, Zomba, Malawi
Submission: January 29, 2018; Published: February 22, 2018

ISSN: 2578-0247Volume1 Issue2
Abstract
A retrospective cohort study was done on adult Tuberculosis (TB) in-patients from Queen Elizabeth Central Hospital (QECH) Surveillance Programme of In-patients and Epidemiology (SPINE) database to identify factors explaining time to discharge from hospital while accounting for a competing event: death. The study aimed to apply and compare competing risk models on TB data. Semi-parametric Cause-specific hazards (CSH) and Sub-distribution hazard (SDH) models were applied to model the effect of HIV status, age, and Sex in relation to death or discharge from hospital. Test for model assumptions and diagnostics were conducted. Findings showed that the SDH explained best the effect of the covariates to the probability of a patient being discharged or dying. Further the main factors affecting length of hospital stay among TB in-patients were age and HIV Status. HIV positive patients were 17.6% less likely to be discharged from hospital compared to HIV negative patients (p=0.048) and an increase in age, resulted in 2% decrease of chances of discharge. The study showed the importance of using cumulative incidence function for calculating probability of being discharged in the presence of a competing event death. To meet the objective of identifying prognostic factors of discharge in the presence of a competing event, the sub-distribution hazard model explained better the covariate effects on event discharge than the CSH model. The findings emphasize the importance to use competing risk methods which best meet the study objectives.
Keywords: Tuberculosis; Competing risk; Cumulative Incidence Function (CIF); Cause-specific hazards (CSH); Sub-distribution hazards (SDH); Length of hospital stay (LoS)
Abbreviations: CSH: Cause-Specific Hazards; SDH: Sub-Distribution Hazards; CI: Cumulative Incidence
Introduction
Tuberculosis remains a major public health problem worldwide. It is estimated that one-third of the world population is infected with Mycobacterium tuberculosis [1]. The severity of tuberculosis in the world has worsened with social inequality, the advent of acquired immunodeficiency syndrome (AIDS) and migratory movements between countries [2]. In 2013, WHO reported 9 million people around the world suffering from TB, and about 1.5 million TB- related deaths worldwide [3]. In Malawi TB is a major public health problem, with the incidence of all forms of TB being estimated to be 164 per 100,000, as reported by the WHO.3 In Malawi, TB has had a great impact on the socio-economic well-being of the country [4]. It is reported that on average, patients spend 29 US dollars to access facilities offering diagnostic and treatment services for TB, though it is reported that the cost per person successfully treated for TB with first line drugs is in the range of 100 USD to 500 USD in all countries with high burden of TB [5,6]. In view of this, there is a need to understand different aspects surrounding care for TB patients, including factors related to hospitalization. It is therefore, important is an analysis of the patients' length of stay (LOS) in hospital, as this can guide future resource allocation for the treatment of such patients.
Length of Hospital Stay
Determination of factors that increase LOS may provide information that can help to reduce costs and improve delivery of care [7]. Most studies on length of hospital stay have shown that LOS is an important measure of resource utilization [8-12], as well as explaining hospital costs, evident in several studies. Thus, understanding length of stay is vital for planning and funding services [13]. Competing risk models would be considered the most appropriate for length of stay. There is large body of literature on competing risk models for analysis of time-to-event data in medical research [13-16]. Despite these studies and papers on LOS, a few studies have looked at modelling length of hospital stay for TB patients and have often not accounted for competing events. Gooley states that ignoring competing risks and applying standard survival models to a dataset that includes competing events leads to biased estimates thus leading to biased conclusion [17]. Failure to account for this would lead to invalid estimates of time to discharge. This study thus aimed to apply competing risk models on time to discharge for adult TB in-patients at QECH with death as a competing event; and identify prognostic factors that influence the average length of stay of TB patients in Malawi using models that take competing risk into account.
Material and Methods
Study design, data management and data description
The study used secondary data from Surveillance Programme of In-patients and Epidemiology (SPINE) project, collected at Queen Elizabeth Central Hospital, in Malawi. This study was a retrospective cohort analysis of data from people with all forms of TB in the year 2014, (from 1st January 2014 to 28th November, 2014). SPINE (Surveillance Programme of In-patients and Epidemiology) project is a computerized real time data collection system. The approval to use this data was obtained from the College of Medicine Ethical Committee. The data was first cleaned, and then sorted for easy navigation when doing analysis.
Study size and sampling procedure
A representative sample of 4500 TB admissions were available in the dataset of adults in the required age group of 15 years and above which was the target population of this study. The study analyzed information from 2220 TB patients who were admitted with TB during the interested study period.
Study outcome
The main outcome variable of this study was time to discharge from hospital. Time to death was also considered as an outcome variable but was used as purpose of explaining its effect on modelling time to discharge with death as a competing event; and Transferred, Referred and absconded as censored.
Statistical methodology
We used the competing risk survival analysis modelling approach to study Length of hospital stay and factors that are associated to LoS. Hinchliffe et al. [18] stated that competing risk models are statistical methods suitable for modelling length of hospital stay in the presence of significant rates of in-hospital mortality. They added that, these methods are important for situations where ignoring the in-unit deaths would likely give biased estimates [18]. Competing risks are represented by the failure time T, the failure cause D and a vector of covariates Z. T is assumed to be a continuous and positive random variable, D takes values in a finite set. The failure cause D can be either the event of interest, in our case D=1 representing "Discharge" D=2 representing "Death" and D=3 representing "Censored"
Competing risks models are important in the TB wards because a large proportion of patients may either die or be discharged, where if one dies, the event of being discharged will not be observed. Competing risks models offer significant advantages over standard survival analysis when competing events exist [19]. Thus the standard survival models cannot be used to analyse competing risk data especially when we want to observe the effects of the covariates on both events (dying or being discharged) since the standard models would observe one main event of interest and the rest would be treated as censored observations. The statistical methodology for analysing competing risks data has rapidly expanded over the last decades [20]. However, clinical studies often ignore competing risks or the multistate process of clinical endpoint generation [21].
Cumulative Incidence Function
A competing risk must be accounted for in estimating failure rates. One of the best approaches of assessing failure rates is by using the cumulative incidence curve to estimate the probability of failures actually observed in patients who are subject to censoring by competing risk [16]. The cumulative incidence denotes the expected proportion of patients with a certain event over the course of time [22]. The CIF is closely related to the survivor function encountered in standard survival analysis. The CIF at time, t, for cause, i, is the probability of failing from cause, i, before (or up to) time, t, it represents the probability that an event of type, I, has occurred by time, t. It is represented as;

When studying the survival for admitted TB-treated patients till discharge, a patient may either die while on treatment or the patient may be transferred to other departments. These two events are competing against being discharged. In this study we consider a transfer as a person being censored, since the event of being discharged can be observed from the other wards. This implies that the KM method would regard death of a TB patient as censored and thus wouldn't consider it as an event that precludes the event of being discharged. However, if there is more than one type of event (or failure), and if these events are dependent, KM estimates are biased [17]. Therefore analysing the data using competing risk models would be appropriate.
The Cause-Specific Hazard Function
The cause-specific is a common alternative approach to the CIF. The cause-specific hazard refers to the instantaneous risk of failure from a specified cause given that no failure from any cause has yet occurred. Formally if failure can occur for any i =1,...,k causes. The CSH for cause i at time t is given as

T is equal to time to first failure from any cause i. A subject will still be at risk at time t given that the subject has not died of cause i or any of thei-1 other causes. For D e {1,2,.,k}, It represents the hazard of failing from cause i in the presence of the competing events. The regression model on cause-specific hazards is as follows:
h, (t|x) = h0i (t) exp(βx) (3)
Where X is a vector of explanatory variables and p is a vector of coefficients. The total risk of any event happening, the overall hazard rate is

The typical "cause-specific" approach for analysing competing risks data is to perform a standard Cox regression for each event type separately, where the other competing event types are treated as censored categories. There are two primary drawbacks of the above method. One problem is that the above method requires the assumption that competing risks are independent [23] which is not the case when dealing with competing risk data.
In competing risks, each event has an associated hazard function known as the cause-specific hazards (CSH). A cause specific hazard quantifies the risk of experiencing an event from a particular cause [23]. The Cox-Proportional hazards may be used to model the cause-specific hazards in regression modelling [24]. However testing for equality of CSH is not equivalent to testing the equality of CIF [25].
Several modelling approaches are available for evaluating effects of covariates on the cause-specific outcome in competing risk data [26]. Two popular approaches are (1) modelling the cause-specific hazard of each event separately by applying the standard Cox regression for the event of interest and censoring all other observations. The second approach is Fine & Gray's [26] extension of the Cox regression that models (the hazards) the CIF.
The relationship between the CIF i(t) and the cause-specific hazard is mathematically represented as;
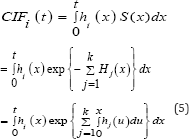
Where S(x) is the overall survivor function, Hj(x) is the cause- specific for cause j, which is integrated from 0 to x of the CSH for cause j.
Cause-specific hazards can inform us about the impact of risk factors on rates of disease or mortality, while the cumulative incidence functions provide an absolute measure with which to base prognosis and clinical decisions on [20]. Although the CSH's and the CIF are reported separately, Hinchliffe, 2011 did a study that would model competing risks scenarios using an approach that estimates both the cause-specific hazards and the cumulative incidence functions as they believed both to be useful measures. Such an approach was defined by Fine and Gray [26].
Sub-Distribution Hazard Model
In recent years, research methods centered on directly assessing covariate effects on a CIF have been developed. One important work is the proportional sub-distribution hazards model proposed by Fine and Gray [26]. This approach directly measures the covariate effects on the cumulative failure probability due to one risk, in the presence of other risks. Fine and Gray [26] specify a model for the sub distribution hazard formally defined for failure cause i as

This hazard generates failure events of interest while keeping subjects who experience competing events "at risk" so that they are counted as not having any chance of failing. As in any other regression analysis, modelling CIF for competing risks can be used to identify potential prognostic factors for a particular event in the presence of competing risks, or to assess a prognostic factor of interest after adjusting for other potential risk factors in the model. The cause-specific hazard model may be more clinically understandable when assessing the prognostic effect of the covariates on a specific cause because the covariate effect would be to reduce or increase the instantaneous probability of the event of interest irrespective of other covariate effect. However, when the study objective is to compare the probability of the event of interest, then the sub-distribution hazards model will be appropriate [15]. The sub-distribution model is more desired because it assesses covariate effect on CIF directly unlike cause-specific model which is an indirect measurement. The sub distribution hazard model can be used to calculate the CIF from it by the equation;

Where  is the cumulative sub-hazard. The sub-distribution hazard model is semi-parametric in that the baseline sub hazard
  (covariates set at zero) is left unspecified, while the effects of the covariates x are assumed to be proportional;

This study will apply both the Sub-distribution model and Cause-specific model to assess the effects covariates have on the cumulative probability of being discharged taking into account that a patient can die within the hospital period. Both types of modelling will be applied since we are interested in assessing the prognostic effect of the covariates on a specific cause (being discharged) and at the same time we want to compare the probability of the event of interest.
Ethical consideration
Full ethical approval was granted by College of Medicine Research Ethics Committee (COMREC) to collect data from Queen Elizabeth Central Hospital. Patients' names were not used during analysis so as to uphold confidentiality.
Results
Table 1: Baseline characteristics.
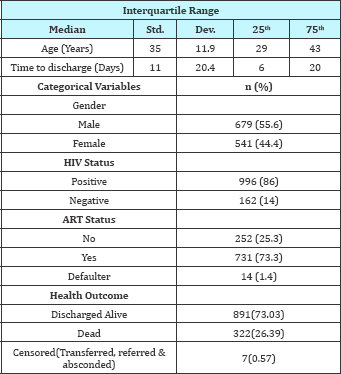
Table 1 gives a summary of the baseline characteristics of the patients included in the study. 1325 patients who were admitted at QECH between January 2014 and November 2014 for TB related diseases. Out of 1325, the study analysis considered a total of 1220 TB-infected patients. The median time to discharge for TB patients in the year 2014 was 11 days. Out of 1220 TB patients, 891(73.03%) were discharged alive while 322 (26.39%) died while in hospital and 7 (0.57%) where either transferred, referred or absconded the admission, 678 were males representing 55.6% and 996 (86%) patients were registered as HIV positive. Out of the 996 HIV positive patients, 731 (73.3%) were on ART therapy, while 252 (25.3%) were not on ART therapy. Table 1 show that, the percentage of TB patients who were HIV positive was high (86%) as compared to TB patients without HIV.
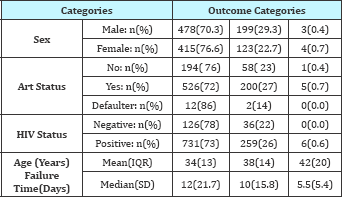
The primary diagnosis variable which explained the patients diagnosis at admission constituted of different type of Tuberculosis, which included; Tuberculosis Miliary, TB sepsis, TB spinal, TB meningitis, TB pulmonary etc. Length of hospital stay was based on the primary diagnosis of all forms of TB. Table 2 shows the baseline characteristics against the dependent variable type of failure. The results from the table showed that there was a high inhospital mortality rate in the various categories. Out of 680 male TB patients, 478 (70.3%) were discharged alive while 199 (26%) died while in hospital. Out of 996 HIV positive TB patient's 731(73%) patients were discharged alive. Out of 162 HIV negative patients 126 (78%) were discharged alive while 36 (22%) died while in hospital. There were no patients who were transferred or referred from this group. Among the HIV positive patients, out of 731 who started ART therapy, 526 (71.96%) were discharged from hospital and 58 (76.68%) died while in hospital. Table 2 shows that, the median time to discharge alive was 12 days and 10 days for patients who died in hospital. The median hospital stay for TB patients at QECH was 11 days.
Table 2: Characteristics of the TB patients by outcome category.
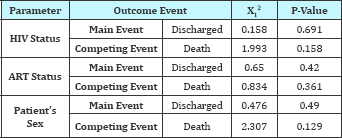
From day 1 the 1KM estimates and the CI estimates were similar. As shown in Figure 1 the estimates for CI and 1KM are similar but as the number of day's increases, the estimates greatly differed from each other. The difference is very noticeable after 10 days and increases with more competing events i.e. death as evidenced from Figure 1. The Pepe and Mori tests, for both events (discharge and death) in Table 3 shows that there is no significant difference in cumulative incidence of discharge and death for patient categories HIV status, ART status and patients gender (p value > 0.05)
Figure 1: Comparison of 1-KM and cumulative Incidence (CI) curves.
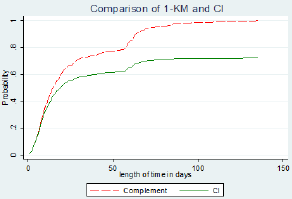
Table 3: Pepe and mori cumulative incidence tests.
Model comparison
A multivariate SDH model was fitted for covariates age, Sex and HIV status as presented in Table 4. The results showed HIV status and age were statistically significant in predicting the sub-hazard of discharge. HIV status had a sub-hazard ratio (SHR) of 0.824 with a p-value of 0.048. HIV positive patients had a 17.6% less sub hazard of being discharged from hospital than HIV negative patients. Older patients again were 1.4% less likely to being discharged with an increase in age by 20 years. Variable sex turned out to be statistically insignificant. The multivariate model of CSH was also fitted for event discharge and competing event death, the hazard ratios (HR) are shown in Table 4. The results show that HIV positive TB patients were 41% more likely to die in hospital than HIV negative patients. Age was the only significant factor affecting time to death in the CSH model. The CSH model for event discharge showed no significant factor. Females are 8% less likely to die in hospital than males, though this effect is not significant. ART status of patients was insignificant for all models with p>0.05. The Multivariate SDH model for competing event death showed that age and HIV status are statistically significant in explaining the cumulative incidence of death.
Table 4: Comparison of multivariate CSH and SDH for event "Discharge" and competing event "Death".
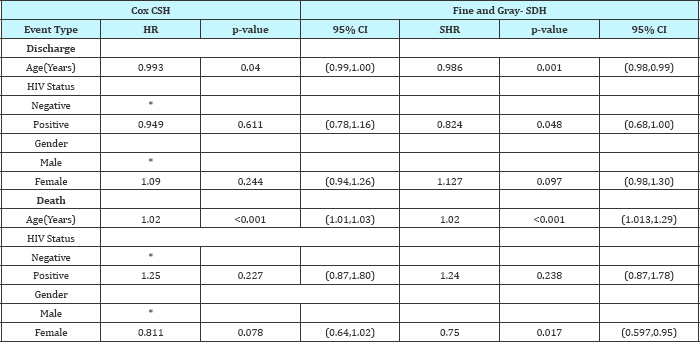
Figure 2: Cumulative incidence by sex for events "discharge" and "death".
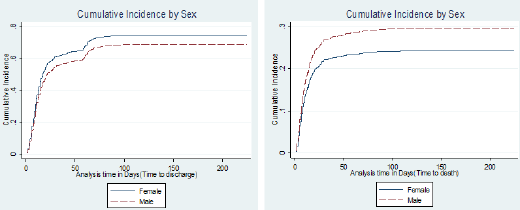
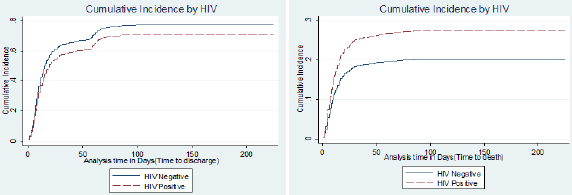
The results show that, the SDH estimates and the CSH estimates were slightly different. This shows that the contribution of death in reducing association between covariates and discharge was minimal. The results from the plots in Figure 2 & Figure 3 represent what has been obtained in the SDH models. For the main event discharge, there's a slight difference between the CI’s for males and females. Females had a higher likelihood of being discharged than males. For competing event death, at day 25, females had a 0.2 cumulative incidence of death than males who had a 0.25 probability of dying within the study period. The CI curves for the variable HIV status for event discharge showed a slight difference in the CI's between HIV positive and negative patients. For event death, HIV positive patients had a higher probability of dying than HIV negative patients as evidenced from the CI curves. With a 0.15 probability of dying for HIV negative patients by day 25 and 0.25 probability of dying for HIV negative patients.
Figure 3: Cumulative incidence by HIV status for events "discharge" and "death".
Discussion
The study took into account competing event (death) to estimate the effect of Age, Sex, Primary Diagnosis and HIV Status on the hazard of discharge for admitted TB treated patients. The 1KM overestimated the probability of being discharged. The 1KM estimates make an assumption of independence among competing events and result in censoring of the competing event. This leads to highly overestimated probabilities for the failure event. This is the case since the 1KM interprets the probability of discharge without taking into account the competing event while the CI takes into account competing events i.e. death. The cumulative Incidence function must be used instead to estimate the probability of survival when dealing with data that has competing events. Several studies and authors [27-29] have pointed out that the CI is an appropriate tool to use for estimation in the presence of competing risks.
The effect of the covariates on the hazard of discharge given a competing event death, was determined by observing the estimates obtained from the CSH model and estimates from the SDH model, if the estimates are similar between the models then the assumption that is used when modelling CSH of independence between the main event and competing event holds [16]. The study showed that covariate estimates between the models SDH and CSH were slightly different with similar confidence interval spans. Based on these results, it implies that death does not affect estimation of the covariates on the main event "Discharge". Although this is the case, ignoring competing risks and applying standard survival models to data that includes competing events leads to biased estimates thus leading to biased conclusion [17].
The results from this study are in agreement with various authors who stated that the SDH model is a better model when studying data that involves competing risks [14,15,26]. Therefore, to meet the objective of identifying prognostic factors of discharge in the presence of competing risks, the sub-distribution hazard model was a better model than the CSH model. Age and HIV status were identified as factors associated with a lower probability of discharge occurring, and a higher probability of death occurring in the sub-distribution multivariable regression modelling (Table 4). This is similar to one study which showed that increasing age was associated with increasing risk of death and length of hospital stay for TB patients [30]. Another interesting result on covariates affecting the probability of discharge taking into account that a death can happen was comparison between HIV positive TB patients and HIV negative TB patients. This variable was significant only in the sub-distribution model. This is possible where more HIV patients experienced the competing event death before a discharge and thus the effect of the competing event on the probability of the main event was noticeable. In this case, if the data involves a lot of the competing events it is best to use the SDH model which takes into account effect of the competing event on the probability of the main event [31]. HIV positive patients were 17.6% less likely of being discharged from hospital and 50% more likely of dying in hospital as compared to HIV negative patients. This is quite a high difference and would need attention of medical researchers to find out why there is such a gap between these two groups. Oliveira in Brazil concluded that a high number of patients with TB/HIV are managed in hospitals. Additionally, according to the Government- funded research conducted in South Africa, HIV positive patients stay in hospital four times longer than other patients on average [32].
Conclusion
A comparison of the Cumulative Incidence (CI) and complement of Kaplan-Meier (1KM) showed that 1KM produced higher probability of the failure event discharge unlike the Cumulative Incidence function. 1KM considers the competing event death as censored and calculates the probability of discharge without taking into account the effect of the competing event death. It is thus important to use the cumulative incidence function to obtain survivorship of an event of interest in the presence of competing events. The study showed that the influence of the covariates on the cause-specific hazard and on the sub-distribution hazard (cumulative incidence) of the event of interest gave different
results. The difference arises since the CSH model looks at the effect of covariates on the event of interest only without regards to how the covariates act on the competing event The study revealed that factors Age and HIV status of a patient were significant predictors in determining hospital stay for TB patients. Older patients and HIV negative patients were more likely to be discharged from hospital within a short stay of hospital admission. The study showed a non-significant effect of ART on length of stay for TB patients. Female patients were more likely to be discharged than males. Thus gender was considered an important factor affecting time to discharge. I would also like to thank Dr. Danielle Cohen for her constructive comments on the clinical aspects of the research. Many thanks to Malawi Liverpool Welcome Trust for providing the SPINE dataset. The authors report no conflict of interest in this work. This work was presented at the Southern Africa Mathematical Sciences Association Conference, Windhoek, 28-27 November, 2015, and a poster presentation was done at Merck Africa Research Summit, Switzerland, in October 2015. © 2018 Halima S Twabi, et al. This is an open access article distributed under the terms of the Creative Commons Attribution License , which permits unrestricted use, distribution, and build upon your work non-commercially.Acknowledgments
Disclosure
References
 a Creative Commons Attribution 4.0 International License. Based on a work at www.crimsonpublishers.com.
Best viewed in


.jpg)


 Editorial Board Registrations
 Submit your Article
 Refer a Friend
 Advertise With Us
.jpg)


.jpg)


.bmp)
.jpg)
.png)
.jpg)


.png)

.png)


.png)


