- Submissions

Full Text
Novel Techniques in Nutrition and Food Science
Segmentation of Local and International Brand of Chips Based on Macronutrients and Micronutrients Content Using Hierarchical Cluster Analysis
Bernadine Ruiza G Ang*
University of the Philippines Diliman, Philippines
*Corresponding author: Bernadine Ruiza G Ang, University of the Philippines Diliman, Manila, Philippines
Submission: March 27, 2018;Published: April 11, 2018

ISSN 2640-9208 Volume1 Issue3
Abstract
Knowing the nutritional value of local and international chips is helpful for avoiding chronic diseases such as obesity, diabetes or cancer. Hierarchical Cluster Analysis will be used to categories these chips according to their nutritional value. Forty-nine samples of local and international chips and eleven macronutrients and micronutrients will be examined. Multivariate Statistical Analysis of data using hierarchical cluster analysis (HCA) technique will be utilized through SPSS program. California Crunch was the most caloric with 210kcal. Miaow and Pods offered the highest in protein content, with the same value of 4g. In total fat, Loaded! (White-Choco) contains the highest with 13g of fat. Pee Wee (BBQ) has the highest sodium content with 390mg. Tattoos Corn Tube contains the highest fiber with 4g. For carbohydrates, the highest again is California Crunch, evidently portraying the relevance and relationship between carbohydrate and calories. Moby and Pillows both have the highest sugar content with 13g. Terra Sweet Potato contained the highest vitamin A with a value of 50%. The highest calcium content is 15% from Outback. Chip n’ Chip and Pringles both have the highest vitamin C with 10%. Pods also contained the highest with 40%. HCA can be used as a tool to educate consumers on the nutritive value of chips and help consumers select the appropriate snack that they can include in their diets.
Keywords: Chips; Hierarchical cluster analysis; Nutrition; Metabolism; Carbohydrates; Fat
Abbreviations: HCA: Hierarchical Cluster Analysis; SPSS: Statistical Package for the Social Sciences
Introduction
Research on local and international chips is an excellent model to discover the nutritional content of chips and how they vary depending on type of chips. Little is known that we can improve the nutritional content of chips and enjoy these snacks that are known to be unhealthy. Food fortification can indeed make this a reality and therefore research on the nutritional content of these chips is an effective method to begin with. Macronutrients are defined as protein, fat, carbohydrate and sugar while micronutrients are defined as vitamin A, calcium, vitamin C and iron. Excessive calories, protein, fat, sodium, carbohydrate and sugar are a few of the main sources of chronic diseases such as diabetes, obesity and cancer. Aggravated effects of these diseases can lead to fatality. It is essential to know how much macronutrients and micronutrients we intake.
In this research, the researcher will concentrate on the clustering of calories, protein, fat, sodium, fiber, carbohydrate, sugar, vitamin A, calcium, vitamin C and iron within these chips. In studying the metabolic pathways of some macronutrients such as fat and carbohydrate, triglyceride coming from fat will split its components-glycerol and three fatty acids. The glycerol portion will undergo gluconeogenesis which is the generation of glucose while the remaining three fatty acids will go through the Krebs cycle which is irreversible. In realizing this, we comprehend how excess fat through glycerol can be converted to glucose which is a form of carbohydrate. For carbohydrate, their composition will continue on to gluconeogenesis and glycollysis which will form or breakdown carbohydrate respectively into glucose entering Krebs cycle as well and consequently then generating ATP, a source of energy that we use as our fuel. From this, we comprehend the interrelationships of nutrients such as fat and protein as a general example.
Cluster Analysis is a statistical technique that groups similar objects together. Hierarchical cluster analysis (HCA) will be used to classify chips according to their macronutrient and micronutrient composition. Hierarchical cluster analysis is a type of cluster analysis and follows three basic steps: calculate the distances, link the clusters and choose a solution by selecting the right number of clusters [1]. Again, the primary purpose of this study is to investigate the classification of calories, protein, fat, sodium, fiber, carbohydrate, sugar, vitamin A, calcium, vitamin C and iron in local and international brand of chips.
Data description
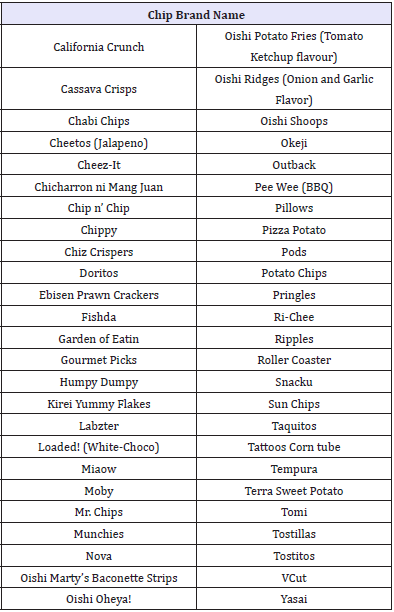
The study used data collected in local and international chips from UniMart supermarket and SM Center point grocery. Manual data gathering using simple random sampling was observed. 49 chips were evaluated according to the nutrition facts label at the back of each chip. Nutritional Facts for each chip was collected and tabulated in Microsoft Excel. The following were obtained: calories, protein, fat, sodium, fiber, carbohydrate, sugar, vitamin A, calcium, vitamin C and iron. Each value for each chip was recorded in Table 1.
Table 1: List of chips.
Research Methodology
Statistical Package for the Social Sciences (SPSS) was utilized to analyze and further obtain the frequency of each chip. This study was conducted starting December 2016 in Manila, Philippines. Pub Med was utilized to search similar studies on the said topic. Application of Multivariate Technique especially cluster analysis is appropriate in the given data set. It sought to use to form clusters from the brand chips based on the nutrients content for each chips. A Hierarchical Cluster Analysis will help for finding relatively homogeneous clusters of cases based on measured characteristics. It starts with each case as a separate cluster, i.e. there are as many clusters as cases, and then combines the clusters sequentially, and reducing the number of clusters at each step until only one cluster is left [2]. The clustering method uses the dissimilarities or distances between objects when forming the clusters. The SPSS programmer’s calculates ‘distances’ between data points in terms of the specified variables. A hierarchical tree diagram, called a dendrogram on SPSS, can be produced to show the linkage points. The clusters are linked at increasing levels of dissimilarity.
Statistical Analysis
Eleven macronutrients and micronutrients compositions of forty-nine local and international brand of chips were investigated. The observed macronutrients and micronutrients were: calories, protein, fat, sodium, fiber, carbohydrate, sugar, vitamin A, calcium, vitamin C and iron. Prior to HCA, the data was transformed and scaled. Hierarchical Cluster Analysis was then used to define the elements of macronutrients and micronutrients in local and international chips. It was performed to assess the similarities of the chips. Ward’s method was used as a cluster method. The interval measure is Squared Euclidean distance. The transform values were standardized according to Z scores by variable. A dendrogram was utilized to visualize the similarity between samples are nested treelike structures, and usually reflect a development sequence. Each chip is treated as a separate and distinct cluster to begin with. They are merged using an appropriate similarity measure until every object belongs to a large cluster. It may help for “seeing the market structure” in terms of brands.
Results and Discussion
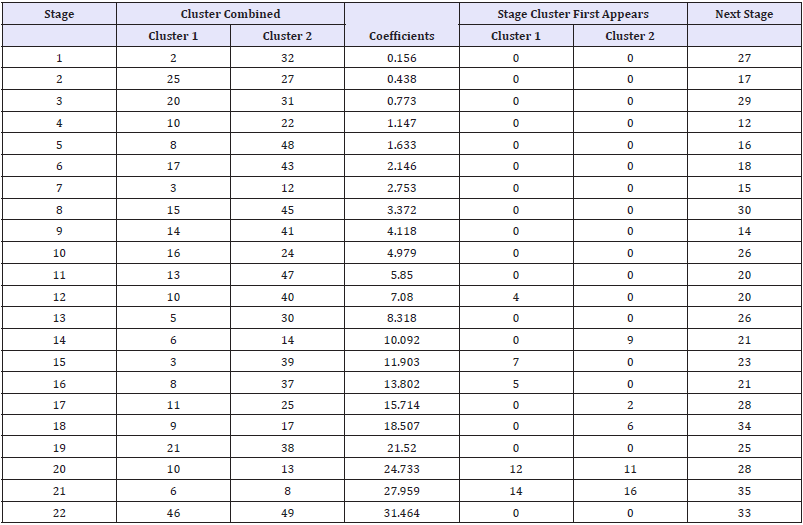
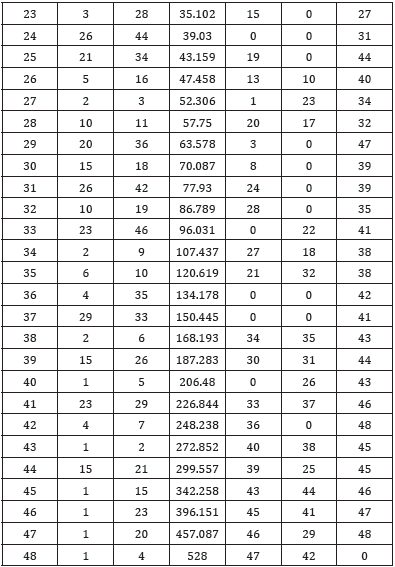
Table 2 presented below shows the summary of reports. In cluster 1, the mean for calories is 154.170kcal which is the highest compared to cluster 2 which yields 79kcal as the mean while the third cluster has 152kcal. For protein, cluster 3 contains 6.4g which is the highest and consequently the mean for cluster 1 is 1.91g while the mean for cluster 2 is only .85g. For fat, cluster 3 yields the highest with 34.6g while cluster 1 got 8.02g while cluster 2 has 4.35g. For sodium, cluster 3 has the highest value with 297mg while cluster 1 has 191.96mg and cluster 2 only has 93.5mg. For fiber, the mean highest is 3.4g which belongs to cluster 3. The next highest mean is .92g from cluster 1 and .50g from cluster 2. For carbohydrates, the highest mean is 18.57g from cluster 1. Cluster 3 was the next highest with 18.08g and cluster 2 with a mean of 8.5g. For sugar, the highest value is 2.42g from cluster 1. The next highest is 1.10g from cluster 2 while the last is 0 from cluster 3. For vitamin A, the highest mean is 10.55% from cluster 1. The other values from cluster 2 and 3 were both 0%. For calcium, the highest mean is 1.4894% from cluster 1. Cluster 2 has 1% while cluster 3 has 0%. For vitamin C, the highest mean is from cluster 3 which yield 25%. The second highest is from cluster 2 with 5% mean. The lowest would be .2979% from cluster 1. Lastly, for iron, the highest is 5.4% from cluster 1. The next highest is 4% from cluster 3 then 1% from cluster 2. In general, cluster 1 is high in calories, carbohydrates, sugar, vitamin A, calcium and iron. Cluster 3 is high in protein, fat, sodium, fiber, and vitamin C. It is advisable to follow or intake brands under cluster 2 since they are not high in fat, carbohydrate, sodium or sugar. It is also evidently projected that there is almost an insignificant portion of micronutrients such as vitamin A, calcium, vitamin C and iron with only 25% as the highest from vitamin C, 10.55% from vitamin A, 5.4% from iron and only 1.489% for calcium. Using HCA was efficient in determining the macronutrients and micronutrients for each cluster. The result of the cluster analysis is summarized in the agglomeration schedule. For instance, at stage 1 (row 1), we see that case 2 and case 32 are combined. The squared Euclidean distance between these two is displayed in the coefficient column. The cluster created by their joining next appears in stage 27. In stage 27, the observations 2 and 3 were joined. The resulting cluster next appears in stage 34.
Table 2: Summary of statistics of clusters.
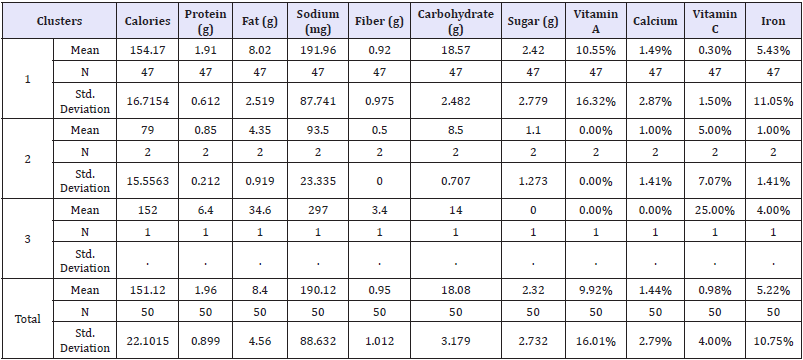
Table 3: Agglomeration schedule.
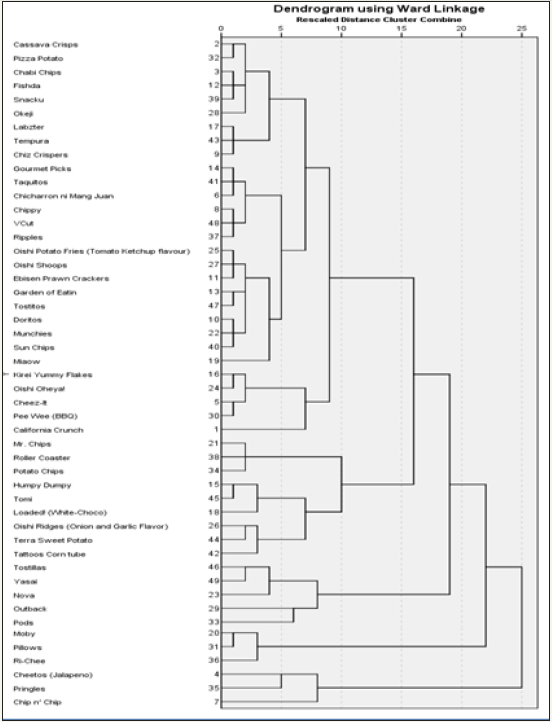
Figures 1: Dendogram.
Based on matrix of proximity, the diagram for dendrogram can be used. There are several ways of grouping these points in multidimensional space to form hierarchical clusters. Two samples close to each other have similar values. Hence, the greater proximity between measures has the greater the similarity. The Agglomeration Schedule (Table 2) follows the proximity matrix in the output. The agglomeration schedule displays how the hierarchical cluster analysis progressively clusters the cases or observations. Each row in the schedule shows a stage at which two cases are combined to form a cluster, using an algorithm dictated by the distance and linkage selections. The agglomeration schedule lists all of the stages in which the clusters are combined until there is only one cluster remaining after the last stage. The number of stages in the agglomeration schedule is one less than the number of cases in the data being clustered. In this example, there are 48 stages because the sample consists of 47. The coefficients at each stage represent the distance of the two clusters being combined. Inconclusive result observed in the third cluster having single chip (Table 3).
As mentioned previously, a hierarchical cluster analysis is best illustrated using a dendrogram, a visual display of the clustering process (Figure 1). It appears at the very end of the SPSS output. Examining the dendrogram from left to right, clusters that are more similar to each other are grouped together earlier. The vertical lines in the dendrogram represent the grouping of clusters or the stages of the agglomeration schedule [3]. They also indicate the distance between two joining clusters (as represented by the x-axis, located above the plot). As the clusters being merged become more heterogeneous, the vertical lines will be located farther to the right side of the plot, as they represent larger distance values. While, the vertical lines are indicative of the distance between clusters, the horizontal lines. Cluster analysis results are shown by a dendrogram (Table 4), which lists all samples and indicates the level of similarity of any two clusters joined (Figure 1). In the dendrogram below, sample 2-32 is examples of most similar among a few such as sample 3-12-39 and 17-43-9. The last two clusters to form are sample 2-32-3-12-39-28 and 4-35-7.
Table 4: Cluster analysis results are shown by a dendrogram.
Conclusion
Using Cluster Analysis, the data observed of 3 cluster of brand of chips. This paper has shown that Cluster analysis determines how many ‘natural’ groups there are in the sample. It also allows you to determine who in your sample belongs to which group. Cluster analysis is not as much a typical statistical test as it is a ‘collection’ of different algorithms that put objects into clusters according to well-defined similarity rules. Hierarchical cluster analysis is suggested as a practical method in identifying meaningful clusters within samples that may superficially appear homogeneous.
References
- Statistics Solutions (2015) Conduct and interpret a cluster analysis. Chicago, USA.
- IBM. Hierarchical Cluster Analysis.
- Odilia Yim, Kylee TR (2015) Hierarchical cluster analysis: comparison of three linkage measures and application to psychological data. The Quantitative Methods For Psychology, pp. 8-21.
© 2018 Bernadine Ruiza G Ang. This is an open access article distributed under the terms of the Creative Commons Attribution License , which permits unrestricted use, distribution, and build upon your work non-commercially.
 a Creative Commons Attribution 4.0 International License. Based on a work at www.crimsonpublishers.com.
Best viewed in


.jpg)


 Editorial Board Registrations
 Submit your Article
 Refer a Friend
 Advertise With Us
.jpg)


.jpg)


.bmp)
.jpg)
.png)
.jpg)


.png)

.png)


.png)


