
- About Us
- Guidelines
-

The Author ensures that the research has been conducted responsibly and ethically with adherence to all relevant regulations. read more..
- For Authors
- For Reviewer
- Manuscript Guidelines
- Membership
-
- Journals
- Reprints
- e-Books
- Videos
- Indexing
- Contact Us
 COVID-19
- Submissions


Full Text
Modern Concepts & Developments in Agronomy
The Impact of Agricultural Training on the Technical Efficiency of Smallholder Rice Producers in the Gambia
Lamin Dibba1*, Manfred Zeller2 and Aliou Diagne3
1University of Hohenheim, Gambia
2Uganda and University of Hohenheim, Germany
3Gaston Berger University, Senegal
*Corresponding author: Lamin Dibba, University of Hohenheim, Stuttgart, Germany, the Africa Rice Center, Cotonou, Benin and National Agricultural Research Institute, The Gambia
Submission: March 19, 2018;Published: May 09, 2018

ISSN: 2637-7659 Volume2 Issue3
Abstract
This paper assesses the impact of agricultural training on technical efficiency using country-wide data from 515 rice producing households in The Gambia. We use the Data Envelopment Analysis technique to generate technical efficiency scores and to identify factors influencing technical efficiency using a Tobit model. We apply propensity score matching, using technical efficiency scores as the outcome variable, to control for selection bias and identify causal effects of participation in agricultural training programs. To test the plausibility of conditional independence, we conduct Rosenbaum bounds sensitivity analysis with matched data as well as mean absolute standard bias tests between participants and non-participants. The results indicate that agricultural training significantly increases the technical efficiency of smallholder rice farmers by 10 percentage points. Further analysis reveals that farmer contact with extension workers and association membership are significant factors influencing technical efficiency.
Keywords:Technical efficiency; Impact; Agricultural training; Propensity score matching; Tobit; The Gambia
JEL Classification
D13, D22, Q12, Q18
Introduction
The demand for rice is rapidly increasing in many countries in sub-Saharan Africa. To keep pace with increasing demand, sub- Saharan African countries have increased rice production almost five times in the past 50 years from 3.14 million to 14.6 million tonnes [1]. Despite this rapid increase in rice production, about 40% of rice consumed in sub-Saharan Africa is imported [2]. The high importation of rice in sub-Saharan Africa is mainly due to low rice productivity, which is largely attributed to a low adoption of high yielding improved rice varieties and to the prevalence of inappropriate rice cultivation practices. Appropriate rice cultivation practices that are used in Asia are not commonly practiced in sub- Saharan Africa Balasubramanian et al. These factors may result in low yields experienced by rice farmers in sub-Saharan Africa, which cost the sub-region enormous amount of scarce foreign exchange reserves on rice imports. Considering that rice is a major staple crop in many sub-Saharan African countries and that rice has enormous potential for increases in productivity, concerted efforts are urgently required to increase rice production for the attainment of food security and poverty reduction [3,4].
Rice is the main staple crop in sub-Saharan African countries like The Gambia. The per capita consumption of rice is estimated to be 117kg per annum, which is one of the highest in sub- Saharan Africa. Low rice production and productivity has led to a 65% increase in rice imports in The Gambia between 2000 and 2011. This has resulted in substantial spending, equivalent to US $28.97 million on national foreign exchange reserves in 2011 [5]. Although, the country is committed to a policy of achieving rice selfsufficiency through the Back to Land Initiative, little progress has been made. Hence, training farmers on improved rice cultivation practices to improve technical efficiency of rice producers is of high priority to attain food security in The Gambia.
There are many projects and programs recently introduced in The Gambia to build the capacity of small-holder rice producers. The most notable among them are the Farmer Managed Rice Irrigation Project (FMRIP) and Participatory Learning and Action Research (PLAR). The FMRIP was officially introduced in The Gambia in 2006. Its main objective was to give extension staff and small- holder rice farmer’s knowledge and skills required to manage tidal rice irrigation schemes in a sustainable manner [6]. PLAR is rice farmer training program developed by Africa Rice to equip rain-fed inland valley rice farmers with knowledge and skills required to increase rice production substantially in inland valleys [7].
The total surface area of inland valleys in sub-Saharan Africa is estimated to be 85 million hectares, which represents about 7% of the total amount of arable in the region [8]. Hence, building the capacity of inland valley rice farmers through agricultural training programs should go a long way in augmenting rice production in sub-Saharan Africa. Currently, rigorous effects are being undertaken by The Gambia government to achieve self-sufficiency in rice production. To achieve this objective, decision makers need guidance on agricultural technologies and programs to improve rice production and productivity. Although many agricultural training programs have been implemented in The Gambia to improve rice production, there is no evidence in the existing literature regarding the impact of such programs on the technical efficiency of rice producing households.
This study attempts to bridge this gap by providing empirical evidence using country-wide data from a random sample of 515 rice producing households. We used a two-stage estimation procedure to assess the impact of agricultural training on the technical efficiency of rice farming households. In the first stage, we estimate technical efficiency scores using the non-parametric Data Envelopment Analysis (DEA) procedure. In the second stage, we apply Propensity Score Matching (PSM) using technical efficiency scores obtained from the first stage estimation to identify the impact of agricultural training on the technical efficiency of rice producers. We conduct a covariate balancing test and sensitivity analysis to assess matching quality and determine the robustness of the propensity score estimates against hidden bias. The rest of this paper is organized as follows: Section 2 presents literature on agricultural training programs in The Gambia; Section 3 presents the data and sampling methodology; Section 4 provides the empirical framework to estimate technical efficiency scores, as well as the matching procedure to assess the impact of agricultural training on technical efficiency; Section 5 presents the impact estimates derived from propensity score matching; and Section 6 concludes with a summary of the main findings and their policy implications.
Agricultural Rice-Farmer Training Programs in The Gambia
There are several projects and programs introduced in The Gambia over the past decade that have capacity building components for small-holder rice farmers. Among these projects and programs, the ones that are specifically introduced to train rice farmers are the Participatory Learning and Action Research (PLAR) program, the Farmer Managed Rice Irrigation Project (FMRIP), and a Canadian International Development Agency (CIDA) funded project. Each of these projects and programs provide training for rice farmers on specific aspects of the rice production process.
The PLAR rice farmer training program was introduced in The Gambia in 2005 under the Participatory Adaptation and Diffusion of Technologies for Rice-Based Systems (PADS) project. The objective of the PLAR was to give rice farmers the knowledge and skills required to effectively manage rice production. The PLAR has a facilitator’s manual which covers 28 modules on the management of rice production, ranging from pre-planting to post harvest operations [8]. Activities of the PLAR in The Gambia were coordinated by the National Agricultural Research Institute (NARI) in collaboration with the Africa Rice Center (Africa Rice). PLAR training begins with the training of trainers (extension agents) who, in turn, conduct farmer training sessions.
In 2007, the NARI in collaboration with Africa Rice conducted training for two-weeks on the 28 PLAR modules for 30 extension workers selected from all of the country’s agricultural regions. Each trained extension worker was also required to train 30 rice farmers. To substantiate trainings conducted by extension workers, the NARI also conducted the PLAR trainings in several villages across the country. The PLAR trainings were mainly conducted for rice farmers operating in lowland inland valleys. In lowland irrigated fields, farmer training was led by FMRIP. The FMRIP was officially introduced in The Gambia in 2006.
The main objective of the project was to increase rice production and incomes of smallholder farmers through irrigated rice land development, capacity building, and rural credit support [6]. The project trained extension workers and irrigated rice farmers on soil and water management of rice fields susceptible to inundation. The training sessions were mainly conducted in the Central River South (CRS) and Central River North (CRN) agricultural regions. The project targeted 100 extension staff that was trained on soil and water management techniques in irrigated rice fields. The extension workers, in turn, were tasked to train 2,300 rice farmers and 90 farmer groups across the central river regions. To substantiate the efforts of PLAR and FMRIP, the CIDA project was introduced to trained farmers on the post-harvest handling of rice. The CIDA-funded post-harvest handling project for rice was officially introduced in The Gambia in 2011. The NARI is the lead implementing institution of the project’s activities.
The main objective of the project is to enhance food security by improving the post-harvest handling of rice, as well as to advance the marketing and development of new rice-based products. The project identified two intervention sites, namely the West Coast Region (WCR) and Central River Region (CRR). The NARI in collaboration with national partners and Africa Rice identified and trained research scientists and extension workers on post-harvest rice handling techniques. The trained scientist and extension workers were also tasked to identify and train 120 women food processors, 200 rice farmers, 30 rice millers, and 30 rice traders within the country on food processing techniques and improved post-harvest practices.
Sampling and Data
Data for this study were obtained from a country-wide survey of rice farming villages and households in 2010. Villages and households were selected through a multi-stage random sampling procedure. The first stage of sampling involved random selection of rice farming communities across the country’s six agricultural regions. With the exception of the West Coast Region1 (WCR), ten rice farming communities were randomly selected in each agricultural region. During the second stage of sampling, a list of all the rice farming households was obtained in each community through key informant interviews. Ten household were randomly selected, except for the WCR, from each rice farming community for total sample size of 600.
This sample was surveyed in 2006 and again in 2010. However, due to migration and other circumstances beyond the control of the survey team, only 515 households could be interviewed again in 2010. We performed statistical tests to determine whether the 85 households that had dropped from the sample are significantly different from the remaining households with regard to important socio-demographic and ecological characteristics to ascertain whether the sample is representative of the population. The data were collected using village and household-level questionnaires. For the village-level questionnaire, in each village, a list of all agricultural projects and programs that provide training for rice farmers was obtained through interviews with contact farmers, community leaders, and extension workers. For the householdlevel questionnaire, the most knowledgeable2 person about household rice farming activities was asked whether any member of the household was trained by any of the listed agricultural projects or programs on rice production practices. If the response was “yes”, then that household was identified as having participated in an agricultural rice farmer training program. Then, the type and duration of training were noted. Afterwards, socio-economic and demographic characteristics of rice farmers and their households were collected.
Empirical Framework
We estimate the impact of agricultural training on technical efficiency in two stages. In the first stage, we use a non-parametric approach to estimate technical efficiency scores for each sampled household and use Tobit regression analysis to identify factors influencing technical efficiency. In the second stage, we employ propensity score matching to assess the impact of the program on participants using technical efficiency scores as our outcome indicator.
Estimating technical efficiency
Technical efficiency3 is a situation a farm household realizes when it is not possible to increase output without increasing the level of inputs use in the production process. Thus a farmer is technically efficient if he or she has achieved the maximum output possible from the combination of a given level of inputs. There are two main approaches to estimate technical efficiency: parametric and non-parametric. The parametric approach involves specifying some functional form that depicts the relationship between input and output use in the production process. The Cobb-Douglass and transcendental logarithmic (translog) approaches are the most widely used parametric approaches to analyze the technical efficiency of farm households.
However, due to the problem of correctly specifying parametric functional forms, non-parametric approaches were developed to estimate technical efficiency. Data Envelopment Analysis (DEA) is the most commonly used non-parametric approach. DEA was developed by [9] to evaluate the efficiency of decision making units. It relies on linear programming to estimate technical efficiency by using the best observed outcome within a group of households as a benchmark for determining the efficiency level of other households. We use the DEA approach to estimate technical efficiency scores for rice farming households based on the fact that it does not require an assumption on a functional form of relationships between inputs and outputs used and produced in a production process. It directly compares household performance against best practices and then estimates efficiency scores for every sample household [10].
When using the DEA approach to estimate technical efficiency, two scale assumptions are used: Constant Return to Scale (CRS) and Variable Return to Scale (VRS). CRS is assumed in situations whereby changes in the level of inputs used results in proportionate changes in the level of outputs. However, in the case of rice farming households4, changes in the level of inputs does not necessarily lead to proportionate changes in the level of outputs. Under such circumstances, CRS is less likely to be a reasonable assumption. In such cases, it is rational to assume VRS. VRS is a suitable assumption when changes in input levels lead to increasing, constant, or decreasing returns to scale. Hence, we assume VRS to estimate technical efficiency scores.
Letting ij x denote the total value of the type of input j used in the production process for a rice farm household i ( xg0,i=1,2,.... l,j=1,2,....j )and ynk denote the amount of output k produced by household (ynk≥k = 0, 1,2,....K ) , following Coelli (1995), the technical efficiency for a given household n is obtained by solving the following Linear Programming Problem (LP) using the DEA model under the assumption of VRS:
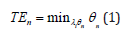
Where:
TEn is the technical efficiency score for household n
λiis the nonnegative weights for household i
n is the total number of households
xij is input j used by household i
xnj is input j used by household n
yik is the amount of output k produced by household i
ynk is the amount of output k produced by household n
θnis a scalar vector ≤1 that defines technical efficiency for
household n
A value of θn equal to 1 indicates a technically efficient household and a value less than 1 indicates a technically inefficient household [11]. The constraint

Table 1:Descriptive statistics of the variables in the DEA model.

Source: Africa Rice/NARI, Gambia Post Impact Assessment survey 2006/2010.
We use a Tobit model to determine the factors influencing the technical efficiency of rice farming households. When estimating technical efficiency scores using the DEA approach, the most efficient households are given a perfect technical efficiency score of one. This creates a variable that is censored from above. If dependent variables are censored from below or above, Ordinary Least Squares (OLS) regression results in biased estimates [12]. Under such circumstances, it is more appropriate to use the Tobit model because it accounts for censoring of the dependent variable [13].
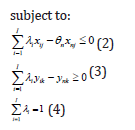
When dependent variables are censored, values below or above a certain range are transformed to a lower or upper bound (1 in our case). As a result, the true value of the dependent variable is not observed for all entities. Hence, we have a latent dependent variable.
Letting TE* denote the latent variable and denote the observed value of the dependent variable, the Tobit regression model is specified as [14]:
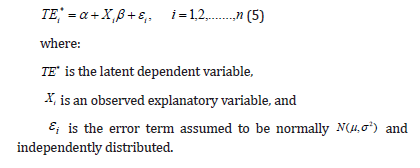
Instead of observing the actual technical efficiency scores TE* of rice farming households, we observe TE :
The marginal effects of the estimated coefficients of the latent dependent variable are estimated as follows:
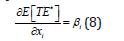
The reported coefficient of the marginal effects of the Tobit model indicate how a one-unit change in an independent variable i x changes the expected value of the latent dependent variable.
Estimating the impact of agricultural training
We use propensity score matching in the second stage to assess the impact of agricultural training on the technical efficiency scores derived from the DEA approach outlined in the previous section. Propensity score matching is an alternative approach to assess impacts of programs or interventions on an outcome variable when randomization of participants into treatment and control groups is not feasible [15]. There are two broad methods used in the evaluation of treatment to identify causal effects of treatments on outcomes of interest. One class of methods is based on the selection of observable factors [16,17]. The other estimators are based on the selection on unobservable factors (Heckman and Vytlacil; Imbens; Abadie; Imbens and Angrist). Propensity score matching is an example of the former cf. [18]. These methods rely on the validity of the conditional independence or ignorability assumption, which suggests the existence of a set of observed covariates, x , which, if controlled for, renders treatment participation independent of potential outcomes5 y0 and y1 . The conditional independence assumption is valid only if program participants do not self-select themselves into treatment and control groups.
In the case of agricultural training programs, where trainees are selected by project officials and agricultural extension agents, conditional independence is likely to be a plausible assumption. Under such circumstances, propensity scoring matching is likely to identify causal effects of treatment [16]. To assess the impact of agricultural training on the technical efficiency of rice farming households, we follow the potential outcome framework proposed by [16]. Under this framework, every household has two potential outcomes: y1 if they participate in agricultural training programs and y0 otherwise.
For a given household , the impact of agricultural training on its technical efficiency is defined as: y0 − y1 . However, the two potential outcomes are mutually exclusive for any given household. We observe only one outcome depending on whether a given household has participated in an agricultural training program or not. Hence, it is impossible to measure the treatment effect of an individual household directly. However, with some fundamental identifying assumptions, it is possible to measure the mean impact of treatment on the treated, which is defined as the average treatment effect on the treated (ATT). The propensity score matching estimator for ATT is based on the validity of the conditional independence assumption (CIA). This assumption states that conditional on observable factors that determine participation in agricultural training programs, there are no unobserved factors that influence participation and observed outcomes. The CIA is formally stated as follows:

A further requirement needed to identify treatment effects is the assumption of common support or overlap of all the values of covariates (x) between the treatment and control groups. This assumption is expressed as follows:

Assumptions (9) and (10) together are referred to as strong ignorability by [17]. Under these assumptions, ATT can be identified for all values of X . Heckman et al. (1998) argue that ignorability is too strong: All that is needed to identify casual effects of treatments is mean independence. In the case of propensity score matching, where the parameter of interest is ATT, ignorability and weak overlap for control groups is sufficient to identify causal effects of treatments [18]. These assumptions are expressed as:
Assumptions (11) and (12) are the ignorability and weak overlap assumptions, respectively. These assumptions are sufficient to identify treatment effects because only a common support is needed to identify counterfactuals for the treatment group. Instead of covariates, propensity score matching assumes independence between the potential outcome and the propensity score. The propensity score is the conditional probability of receiving the treatment and is generally expressed as
If the conditional independence and overlap assumptions hold, the propensity score matching estimator for ATT can be written as:

The propensity score estimator simply takes the mean difference in outcome between participant and non-participant over the region of common support, which is the area where similar propensity scores can be identified for both treatment and control groups.
A balancing test for matched covariates
The main idea behind propensity score matching is to depict a situation that is as similar as possible to randomized control trials. In randomized control trials, both observed and unobserved factors influencing program participation are balanced between treated and control groups. Since matching is based on the assumption that program participation is not influenced by unobserved factors, it is prudent to conduct some form of a balancing test after matching to ascertain whether observed covariates influencing program participation are balanced between treated and control groups. When the balancing property is achieved, then the control group can be used as appropriate counterfactual for the treatment group [20].
Rosenbaum and Rubin [20] proposed mean absolute standard bias (MASB) and t-test for differences in covariates between participants and non-participants to assess matching quality. They recommend that a difference in MASB greater than 20% should be considered too large, which indicates that the matching process failed. Another way of testing the matching quality is to compare the pseudo R2 and the p-values of the likelihood ratio test from the probit or logit regression models obtained before and after matching [21]. To indicate that matching was successful, the pseudo R2 should be lower and the p-value of the likelihood ratio test should be insignificant. In this paper, we conducted all of these tests to assess matching quality. The results of the tests are given in Section 5.4.
Sensitivity analysis to test the conditional independence assumption
The propensity score matching estimator relies on the validity of the conditional independence assumption. This assumption rules out any possible correlation between the treatment and the unobserved factors influencing participation in agricultural training programs. If the conditional independence assumption is violated, results based on the propensity score matching estimator can contain a substantial amount of bias. Hence, it is necessary to scrutinize the results obtained from propensity score matching by conducting sensitivity analysis to test the plausibility of the conditional independence assumption [22].
We conduct sensitivity analysis to ascertain the robustness of our propensity score matching estimates against hidden bias. We use Rosenbaum’s method, which measures the extent to which the odds of receiving treatment may differ among participant and nonparticipants with the same covariates. [20] state that a critical level greater than 1.00 indicates a more robust estimate against hidden bias. A critical level less than 1.00 indicates that there is a substantial amount of hidden bias and thus that the conditional independence assumption and the propensity score matching process failed.
Results and Discussion
Socio-demographic characteristics of households
The socio-demographic characteristics of households by agricultural training status are presented in (Table 2). The results show that households that participated in agricultural training programs have a higher number of educated rice farmers and years of experience in rice farming compared to non-participants. Agricultural training educates farmers about rice production. Hence, we expect participation in agricultural training programs to be correlated with the education level of rice farmers. Agricultural training programs are facilitated by research and extension personnel who are also responsible for recruiting farmer trainees.
Table 2:Socio-demographic characteristics of households by agricultural training status.

NGO: Non Governmental Organization. NARI: National Agricultural Research Institute. Robust standard errors are shown in parenthesis; **P<0.05 and *** P<0.01. Source: Africa Rice/NARI, Gambia Post Impact Assessment survey 2006/2010.
Therefore, farmers who practice rice farming for a longer period are more likely to establish interpersonal relationships with researchers and extension workers. Hence, they should be more likely to participate in training programs led by research and extension personnel. Moreover, the results reveal that participants have more farmers with membership in an association. This is consistent with the finding by [23] in Uganda that a larger number of participants in lowland rice training programs are members of farmer associations.
Furthermore, the results show that higher number of participants in agricultural training programs have contact with the NARI and Non-Governmental Organizations (NGOs). Agricultural trainings programs are coordinated by personnel from research, extension, and NGOs. Hence, it is understandable that participants have a higher number of farmers who have contact with the NARI and NGOs (Table 2).
Determinants of technical efficiency
To identify the determinants of technical efficiency, we use the Tobit model with the estimated technical efficiency scores as the dependent variable and socio-economic and demographic characteristics as independent variables. To determine the magnitude of effect that each of the independent variables has on technical efficiency, we estimate the Tobit marginal effects, which are presented in (Table 3). The results based on the Tobit marginal effects show that the factors that are positively correlated with technical efficiency are: female gender, association membership contact with extension workers, residence in the Upper River Region (URR), the adoption of improved rice varieties, and farmer contact with NGOs.
Female gender, association membership, and residence in the URR increase technical efficiency of rice farmers by 9%. Farmer contact with extension services, farmer adoption of improved rice varieties, and farmer contact with NGOs increase technical efficiency by 5%, 8% and 7%, respectively. Factors that are negatively correlated with technical efficiency are off-farm labor and practice of upland rice farming, which decrease technical efficiency by 6%. The positive correlation of female gender and technical efficiency is not surprising. Rice is predominantly a woman’s crop in The Gambia [24]. The majority of men practicing rice farming started rice cultivation with the introduction of upland rice varieties, such as the New Rice for Africa (NERICA) [5].
During the rainy season, women devote their time almost entirely to rice cultivation. Besides rice cultivation, men are involved in the cultivation of cash crops, such as groundnut and cotton. This gives them less time to effectively manage the rice crop. Since women devote their time to rice cultivation in the rainy season, compared to men, they are more likely to better manage the crop.
Association membership has a positive effect on technical efficiency. Association membership is a vital source of information [25]. Information is crucial for the uptake of new technologies and practices [26,27]. Farmers of the same association can also easily share knowledge and experience about new innovations, including those introduced at agricultural training programs. For this reason, farmers who are members of rice farming association are likely to be more efficient in rice production compared to their counterparts. Off-farm labor and upland rice cultivation are negatively correlated with technical efficiency. Farmers practicing off-farm labor are likely to undertake rice farming as a secondary activity.
Hence, we expect that such farmers are less efficient in producing rice compared to their counterparts who cultivate rice for their major farming activity. Moreover, there are three major rice farming ecologies in The Gambia: upland, lowland rainfed and lowland irrigated. Rice yields are the lowest in upland rice fields [7]. Since rice yields are the only output for estimating technical efficiency, we expect upland rice farmers to be less efficient compared to lowland rainfed and irrigated rice farmers. Farmer contact with NGOs and extension workers is positively correlated with technical efficiency of rice farmers. Farmer contact with extension is a vital source of information acquisition about new technologies and practices [28].
Moreover, agricultural training programs are conducted by researchers, extension workers, and NGO agents who are responsible for selecting participants for agricultural training programs. Hence, farmers who have contact with NGOs and extension workers are more likely to participate in agricultural training programs. Therefore, they are more likely to be efficient in rice production. Moreover, most of the agricultural programs on rice are located in the Upper River Region of The Gambia. Consequently, rice farmers in the Upper River Region are more likely to participate in agricultural training programs and therefore are more likely to be efficient in rice production.
Table 3:Tobit marginal effects of factors influencing technical efficiency.

NGO: Non-Governmental Organization. NARI: National Agricultural Research Institute. URR: Upper River Region. Source: Africa Rice/NARI, Gambia Post Impact Assessment survey 2006/2010. Notes: *P<0.10, ** P<0.05, and *** P<0.01.
Furthermore, there is vast evidence that farmers who adopt improved rice varieties are more productive in rice cultivation compared to farmers who adopt local rice varieties [5,29,30]. Most improved rice varieties are resistant to biotic and abiotic factors affecting rice [31,32]. For this reason, farmers cultivating improved rice varieties are more likely to be efficient in rice production (Table 3).
Descriptive analysis of the impact of agricultural training on technical efficiency
Table 4 presents a descriptive analysis of the impact of agricultural training on technical efficiency. The results are presented for all rice farmers and for male and female rice farmers separately. The results show that participants in agricultural training programs have higher technical efficiency scores than non-participants. The difference in technical efficiency scores is estimated to be 5 percentage points, which is statistically different from zero at the 1% significance level. Female farmers had a technical efficiency score of 6 percentage points greater than male farmers, which is significantly different from zero at 1% the significance level. The results therefore suggest that the impact of agricultural training on technical efficiency is greater for female rice farmers.
The simple mean difference in technical efficiency scores between agricultural training program participants and nonparticipants has no causal interpretation of the impact of agricultural training on technical efficiency. Besides agricultural training, there are many other socio-economic and demographic factors that can affect the technical efficiency of rice farmers. Indeed, the results have shown that participants and non-participants have significant differences in some socio-demographic factors. Such differences must be controlled for to make causal inferences about agricultural training on technical efficiency. In the next sub-section, we use propensity score matching to estimate the impact of agricultural training on technical efficiency (Table 4).
Table 4:Descriptive analysis of the impact of agricultural training on technical efficiency.

Robust standard errors are shown in parenthesis; *P<0.10 and *** P<0.01. Source: Africa Rice/NARI, Gambia Post Impact Assessment survey 2006/2010.
Propensity score matching
The results of the descriptive analysis obtained from the previous section suggest that agricultural training may have a positive impact on the technical efficiency of rice farming households. However, since they are based on observed mean differences in technical efficiency scores between participants and non-participants, they have no causal interpretation of the impact of agricultural training on technical efficiency. Hence, in this subsection, we use PSM to identify causal inference of participation in agricultural training programs on technical efficiency of rice farmers.
Estimating the propensity score:Table 5 reports the factors influencing the propensity to participate in agricultural training programs. We used a probit model to estimate the propensity score based on a number of socio-economic and demographic factors of rice farming households. The results indicate that the most influential factors are whether the respondent is the household head, education, household size, off-farm labor, contact with extension workers, adoption of improved rice varieties, and contact with NGOs (Table 5). The estimated propensity score for participants is between 0.24 and 0.99, whereas that for nonadopters is between 0.0004 and 0.89. To estimate the impact of participation in agricultural program on technical efficiency, we need to identify a region of common support based on the propensity score6 estimates (Figure 1). As recommended by [20], we use a caliper value of one-quarter of the standard deviation of the propensity score to identify the region of common support. It is within the region of common support that we can find participants and non-participants with similar propensity score estimates. Within the region of common support7, a counterfactual can be constructed for participants in agricultural training programs to enable the estimation of treatment effects (Figure 1).
Table 5:Probit regression of determinants of participation in agricultural training programs.

NGO: Non Governmental Organization. NARI: National Agricultural Research Institute. Source: Africa Rice/NARI, Gambia Post Impact Assessment survey 2006/2010. Notes: ** P<0.05 and *** P<0.01.
Figure 1:Propensity score distribution and common support.

Choosing a matching algorithm:The four main types of matching algorithms used in empirical research to estimate treatment effects based on the propensity score matching approach [19] are the Nearest Neighbour Matching (NNM), Radius Matching (RM), Stratification Matching (SM), and Kernel Matching (KM) approach. We estimate treatment effects based on all of these four approaches, but due to sensitivity of the results to hidden bias we focus on estimates obtained from NNM and RM.
Table 6:PSM quality indicators before and after matching.

Source: Africa Rice/NARI, Gambia Post Impact Assessment survey 2006/2010. Notes: *** P<0.01.
Balancing test: A balancing test is required after matching to determine whether the difference in covariates between participants and non-participants was eliminated after matching. The results of the quality indicators before and after matching are presented in (Table 6). The NNM estimates of the mean absolute standardize bias before and after matching are 42.6% and 9.2%, respectively. The results based on RM show that the mean absolute standardize bias before and after matching are 46.2% and 23.4%, respectively. [20] recommend that a mean absolute standard bias greater than 20% after matching is an indication that matching has failed (Table 6).
[21] suggests a comparison of the pseudo R2 and the p-values of the likelihood ratio test from the probit regression obtained before and after matching. After matching, to indicate that matching was successful, the pseudo R2 should be lower and the p-value of the likelihood ratio should be insignificant. The values of Pseudo R2 based on NNM before and after matching are 0.46 and 0.05, respectively, whereas those based on RM before and after matching are 0.46 and 0.32, respectively. The value of likelihood ratio based on NNM after matching is insignificant, whereas that based on RM after matching is significant and different from zero at the 1% significant level. Based on recommendations by [20,21], matching based on NNM was more successful.
Sensitivity analysis:The estimates based of PSM rely on the validity of the conditional independence assumption, which rules out dependence of participation in agricultural training programs based on unobserved factors. If selection into treatment is influenced by unobserved factors, the PSM estimates will contain a substantial amount of bias. For this reason, results based on PSM should be subjected to some form of sensitivity analysis to determine whether they contain a substantial amount of hidden bias [22]. The results of the sensitivity analysis for NNM and RM are presented in Table 7. The critical level of hidden bias based on NNM is 1.25, whereas that based on RM is 1.00. Since a critical level greater than 1.00 indicates a more robust estimates against hidden bias the results based on NNM are, therefore, more robust against hidden bias (Table 7).
Table 7:Sensitivity analysis for selected algorithms.

Source: Africa Rice/NARI, Gambia Post Impact Assessment survey 2006/2010. ATT: Average treatment effect on the treated. Notes: *P<0.10, ** P<0.05, and *** P<0.01
PSM estimates of the impact of agricultural training on technical efficiency:Table 8 reports the PSM estimates of the impact of agricultural training on technical efficiency. The results are presented based on NNM and RM. The result based on NNM shows that agricultural training improves technical efficiency of rice farmers by 10 percentage points, which is statistically different from zero at the 1% significance level. The result based on RM shows that agricultural training only improves technical efficiency of rice farmers by 4 percentage point, which is statistically different from zero at the 10% significance level. Since the balancing test and sensitivity analysis show that the results based on NNM are more robust against hidden bias, the discussions will be based on NNM estimates (Table 8).
Table 8:PSM estimates of the impact of agricultural training on technical efficiency.

ATT: Average treatment effect on the treated. Source: Africa Rice/NARI, Gambia Post Impact Assessment survey 2006/2010. Notes: *P<0.10 and *** P<0.01
Our findings indicate that agricultural training has the ability to positively impact rice production. This is consistent with the finding by [23] that participation in an agricultural training program has the potential to increase lowland rice productivity in Uganda. The finding by [33] that agricultural technologies have the ability to positively impact technical efficiency of rice farming households is also consistent with our results. [34] also found that agricultural training has the ability to positively impact the productivity of rice farmers in Tanzania. These finding clearly show that agricultural training has the ability to impact rice production and productivity positively in The Gambia.
Conclusion
The results from this study indicate that agricultural training has significantly improved technical efficiency of rice farming households in The Gambia by 10 percentage points. This calls for the need to increase government and/or donor spending on agricultural rice farmer training programs to boost rice production and productivity in The Gambia, as well as increased rice farmer participation in agricultural training programs. Our findings indicate that technical efficiency is positively influenced by female gender, contact with extension workers, and association membership [35]. The significant influence of association membership on technical efficiency could mean that agricultural training has some spill over effects, which could occur when farmers who attend agricultural training programs share their knowledge and experience with members of the same association.
The positive influence of female gender on technical efficiency may not necessarily mean that agricultural training programs are more beneficial for women farmers. Rice is mainly cultivated by women who devote their time almost entirely to rice production during the rainy season. Hence, they have more experience than men in rice cultivation, which means that they are more efficient in rice production. We defined participation in agricultural training programs as involvement by a rice farmer in at least one program that trains famers on rice production practices.
Since all rice farmer training programs may not have the same level of effectiveness, we recommended that future studies that assess the impact of agricultural training on technical efficiency should identify specific training programs and activities. This would enable the most effective training programs and activities to be identified. The policy implication of this study is that rice farmers should be encouraged by agricultural extension services to form associations that meet regularly to exchange ideas and information about new developments within and outside their rice farming communities. To ensure that such meetings are regular, associations should be registered and members should be committed to pay regular membership fees [36].
Acknowledgement
The authors would like to acknowledge the financial support provided by the Global Rice Science Scholarship (GRiSS) program for the successful implementation of this study. The technical support provided by the Africa Rice Center (Africa Rice) and University of Hohenheim is also highly acknowledged.
References
- Yamamoto Y, Tsujimoto Y, Fugihara Y, Sakagami J, Ochi S, et al. (2012) Assessing the probability of land submergence for lowland rice cultivation in Africa using satellite imagery and geospatial data. Environment Development and Sustainability 14(6): 955-971.
- Seck PA, Tollens E, Wopereis M, Diagne A, Bamba I (2010) Rising trends and variability of rice prices: Threats and opportunities for sub-Saharan Africa. Food Policy 35(5): 403-411.
- Otsuka K, Kijima Y (2010) Technology Policies for a Green Revolution and Agricultural Transformation in Africa. Journal of African Economies 19(2): ii60-ii76.
- Larson D, Otsuka K, Kajisa K, Estudillo J, Diagne A (2010) Can Africa replicate Asia’s Green Revolution in rice? Policy Research Working Paper, World Bank 5478.
- Dibba L, Diagne A, Fialor SC, Nimoh F (2012) Impact of NERICA adoption on productivity and poverty of the small-holder rice farmers in the Gambia. Food Security 4: 253-265.
- African Development Fund (2005) Farmer Managed Rice Irrigation Project. Technical Appraisal report.
- Wopereis MCS, Defoer T, Idinoba P, Diack S, Dugué MJ (2008b) Participatory Learning and Action Research (PLAR) for Integrated Rice Management (IRM) in Inland Valleys of Sub-Saharan Africa: Technical Manual WARDA Training Series. Cotonou, Benin: Africa Rice Center pp: 128.
- Defoer T, Wopereis CS, Idinoba PP, Kadisha KL, Diack S, et al. (2009) Curriculum for Participatory Learning and Action Research (PLAR) for Integrated Rice Management (IRM) in Inland Valleys of Sub-Saharan Africa: Facilitator’s Manual. Cotonou, Benin: Africa Rice Center pp: 184.
- Charnes A, Cooper WW, Rhodes E (1978) Measuring the efficiency of decision making units. European Journal of Operational Research 2(6): 429-444.
- Coelli TJ (1996) A guide to DEAP Version 2.1: A Data Envelopment Analysis Programme. CEPA Working Paper 96/8, Department of Econometrics, University of New England, UK.
- Coelli TJ (1995) Recent Developments in Frontier Modeling and Efficiency Measurement. Australian Journal of Agricultural Economics 39(03): 219-245.
- Bravo Ureta BE, Pinheiro AE (1997) Technical, Economic and Allocative Efficiency in Peasant Farming: Evidence from the Dominican Republic. The Developing Economics 35(1): 48-67.
- McCarty TA, Yaisawarng S (1993) Technical efficiency in New Jersey school districts, In: HO Fried, CAK Lovell, SS Schmidt (Eds.), The Measurement of Productive Efficiency: Techniques and Applications, Oxford University Press, New York, USA, pp: 271-287.
- Tobin J (1958) Estimation of Relationships for Limited Dependent Variables. Econometrica 26(1): 24-36.
- Rubin DB (2001) Using Propensity Scores to Help Design Observational Studies: Application to the Tobacco Litigation. Health Services & Outcomes Research Methodology 2(3-4): 169-188.
- Rubin DB (1974) Estimating causal effects of treatments in randomized and non-randomized studies. Journal of Educational Psychology 66(5): 688-701.
- Rosenbaum PR, Rubin DR (1983) The central role of the propensity score in observational studies for causal effects. Biometrika 70(1): 41-55.
- Rosenbaum R, Rubin DB (1984) Reducing bias in observational studies using subclassification on the propensity score, Journal of the American Statistical Association 79(387): 516-524.
- Caliendo M, Kopeinig S (2008) Some practical guidance for the implementation of propensity score matching. Journal of Economic Surveys 22(1): 31-72.
- Rosenbaum PR, Rubin DB (1985) Constructing a control group using multivariate matched sampling methods that incorporate the propensity score. The American Statistician 39(1): 33-38.
- Sianesi B (2004) An evaluation of the Swedish system of active labour market programmes in the 1990s. Review of Economics and Statistics 86(1): 133-155.
- Ichino A, Mealli F, Nannicini T (2008) From temporary help jobs to permanent employment: what can we learn from matching estimators and their sensitivity? Journal of Applied Econometrics 23: 305-327.
- Kijima Y, Ito Y, Otsuka K (2012) Assessing the impact of training on lowland productivity in an African setting: Evidence from Uganda. World Development 40(8): 1610-1618.
- Carney JA (1998) Women’s land rights in Gambian irrigated rice schemes: Constraints and opportunities. In: Agriculture and Human Values 15(4): 325-333.
- Kijima Y, Dick, Sserunkuuma (2013) The adoption of NERICA rice varieties at the initial stage of the diffusion process in Uganda. In: African Journal of Agricultural and Resource Economics 8(1): 45-56.
- Caswell M, Fuhlie K, Ingam C, Jans S, Kascak C (2001) Adoption of Agricultural production practices: Lessons learned from the US. Department of Agriculture Area Studies Project, Agriculture Economic Report No. 792. US Department of Agriculture, Resource Economics Division, Economic Research Service, Washington, DC, USA.
- Feder G, Slade R (1984) The acquisition of information and the adoption of new Technology. In: American Journal of Agricultural Economics. American Agricultural Economics Association 66(3): 312-320.
- Rogers E (1983) Diffusion of innovations. Free Press, New York, USA.
- Kijima Y, Sserunkuuma D, Otsuka K (2006) How revolutionary is the “NERICA revolution”? Evidence from Uganda. Developing Economies 44(2): 252-267.
- Mendola M (2006) Agricultural technology adoption and poverty reduction: a propensity–score matching analysis for rural Bangladesh. Food policy 32(3): 372-393.
- Jones MP, Dingkuhn M, Aluko GK, Semon M (1997) Interspecific Oryza sativa X O. Glaberrima Steud. Progenies in upland rice improvement. Euphytica 92 (2): 237-246.
- Wopereis MCS, Diagne A, Rodenburg J, Sie M, Somado EA (2008) Why NERICA is a successful innovation for African farmers: A response to Orr et al. from the Africa Rice Centre. In: Outlook Agriculture 37(3): 159-168.
- Asante BO, Wiredu AN, Martey E, Sarpong DB, Mensah Bonsu A (2014) NERICA adoption and impacts on technical efficiency of rice producing households in Ghana: Implications for research and development. American Journal of Experimental Agriculture 4(3): 244-262.
- Nakaro Y, Kajisa K (2011) The Impact of Access to Credit and Training on Technology Adoption: A Case of the Rice Sector in Tanzania. Selected paper prepared for presentation at the Agricultural & Applied Economics Association’s 2011 AAEA & NAREA Joint Annual Meeting, Pittsuburgh, Pennsylvania, USA, p: 24-26.
- Alston J, Chan Kang C, Marra M, Pardey P, Wyatt T (2000) Meta analysis of rates of return to agricultural R&D: Ex Pede Herculem? Research Report No. 113, IFPRI, Washington DC, USA.
- World Bank (2015) Deposit interest rates.
© 2023 Lamin Dibba. This is an open access article distributed under the terms of the Creative Commons Attribution License , which permits unrestricted use, distribution, and build upon your work non-commercially.
Editor In Chief


.jpg)


Signup for Newsletter

Quick Links
 Editorial Board Registrations
 Submit your Article
 Refer a Friend
 Advertise With Us
Our Recent Edition

.jpg)


Top Editors


.jpg)


.bmp)
.jpg)
.png)
.jpg)


.png)

.png)


.png)


Financial Support

Sponsors

Latest e-Books

Latest Video

 a Creative Commons Attribution 4.0 International License. Based on a work at www.crimsonpublishers.com.
Best viewed in
a Creative Commons Attribution 4.0 International License. Based on a work at www.crimsonpublishers.com.
Best viewed in