- Submissions

Full Text
COJ Nursing & Healthcare
Every Child is Special
Chetan S Patali*
Department of Psychiatric Nursing, Rajiv Gandhi University of Health Sciences, India
*Corresponding author: Chetan S Patali, Department of Psychiatric Nursing, Rajiv Gandhi University of Health Sciences, Bangalore, Karnataka, India, Tel: 9845732545; Email:chetan1309@gmail.com
Submission: February22, 2018;Published: July 06, 2018

ISSN: 2577-2007Volume3 Issue4
Introduction
Today’s children are tomorrow’s responsible citizens of the world. 35 to 45 percent constitutes the young children of total world’s population. The future of our country depends on the health of young people. However, one in 10 children and adolescents have medical problems, below average intelligence, specific learning disability, attention deficit hyperactivity disorder, dyslexia, emotional problems, poor socio-cultural home environment and psychiatric disorders [1,2]. Language is acquired naturally in a sequence of listening, speaking, reading and writing. Failure in any of these processes may lead to serious problems at school, at work and in social situations. There are many types of language disabilities; the most common is dyslexia, which is defined as difficulty in learning to read and spell despite adequate education, intelligence, socio-cultural opportunities and without any obvious sensory deficits. It accounts for 80 percent of learning disabilities [3].
The term “dyslexia” was coined in 1887 to refer to a case of a young boy who had a severe impairment in learning to read and write despite showing typical intellectual and physical abilities. Research on dyslexia throughout the early 20th century focused on the idea that dyslexia stemmed from a visual deficit that involved reading words backwards or upside-down. However, in the 1970s it was suggested that dyslexia stemmed from a deficit in processing the phonological form of speech, which resulted in individuals having difficulty associating word sounds with visual letters that make up the written word. More recent studies using modern imaging techniques have shown differences in the way the brain of a “dyslexic” person develops and functions [3].
Reading and learning are the two things that determine the success of a child during his/her school career. First child learns to read, and then child reads to learn. Reading is therefore of paramount importance in the educational process. Unfortunately, poor reading skills, and therefore poor learning skills, have become a reality for an alarming number of children [4]. Dyslexia is manifested as a variety of specific learning difficulties related to the acquisition of basic skills in reading, spelling and/or writing, such difficulties being unexpected in relation to an individual’s other abilities and educational experiences. International figures show dyslexia occurs in about 4 percent to 10 percent of the population, with around 2 percent being badly affected. More boys than girls are affected [5]. Dyslexia is most common learning disability affecting an estimated 5 to 15 percent of children. A comparative study revealed that the incidence rates of dyslexia vary largely depending on countries or language. Whereas 10 percent of the children in USA and Great Britain are dyslexics, India estimates about 12 percent of the children suffering with dyslexia, Germany estimates that 5-7 percent of the children suffering from the dyslexia (Italy 3 percent). Japan and China report the lowest dyslexia incidence rate of 1 percent [6].
Background of the Study
Reading and learning are the two things that determine the success of a child during his/her school career. First, he learns to read. Then he reads to learn. Reading is therefore of paramount importance in the educational process. Reading is essential in modern societies, but many children have dyslexia, a difficulty in learning to read. Dyslexia often arises from impaired phonological awareness, the auditory analysis of spoken language that relates the sounds of language to print. Unfortunately, poor reading skills, and therefore poor learning skills, have become a reality for an alarming number of children. The Institute for Global Education and Service Learning states that 40% of American children have difficulty in reading or learning to read, and as many as three-quarters of students who are poor readers in third grade will remain poor readers in high school [7].
Several studies have reported an association between dyslexia and implicit learning deficits. It has been suggested that the weakness in implicit learning observed in dyslexic individuals may be related to sequential processing and implicit sequence learning. Dyslexia is the most common of the learning disorders, conditions that interfere with a normally intelligent child’s ability to acquire speech, reading or other cognitive skills. The prevalence of dyslexia is typically higher in males than females in both referred and research-identified samples, and the ratio of males to females is greater in more affected samples. To explore possible gender differences in reading performance, we analyzed data from 1133 twin pairs in which at least one member of each pair had a school history of reading problems and from 684 twin pairs from a comparison sample with no reading difficulties. Although the difference between the average scores of males and females in these two samples was very small, the variance of reading performance was significantly greater for males in both groups. We suggest that a greater variance of reading performance measures in males may account at least in part for their higher prevalence of reading difficulties as well as for the higher gender ratios that are observed in more severely impaired samples [8].
Children who have dyslexia demonstrate an inability to attain language skills which results into poor academic performance. The challenges these students face mainly arise in processing information and having the ability to reproduce it in an understandable fashion. Individuals having dyslexia may demonstrate problems in any of the areas of reading, writing, spelling, or math calculations. Reading impairment is the major learning disability in children. While research on illiteracy has mainly been conducted from a sociological perspective, research on dyslexia has typically been studied from a cognitive-linguistic perspective [9]. Behavior problems of children often result from their negative experiences at school. The stress and frustration they must endure because of their poor achievement cause them to be reluctant to go to school too often have temper tantrums before school and sometimes even to play truant. Cheating, stealing and experimenting with drugs can also occur when children regard themselves as failures. In the same way, there are also certain skills and knowledge that a child must acquire first, before it becomes possible for him to become a good reader.
Basic skills like concentration, visual discrimination, accurate perception and memorizing, skills of association, auditory memory and lateral interpretation are all functions that form the foundation of good reading and spelling. Until a child has mastered these basic skills first, reading will remain a closed or, at most, a half-open book to him. Many dyslexics have trouble with sequencing, i.e. perceiving something in sequence and remembering the sequence. Naturally this will affect their ability to read and spell correctly. After all, every word consists of letters in a specific sequence. To read one has to perceive the letters in sequence, and also remember what word is represented by the sequence of letters in question. Dyslexics may also have trouble remembering the order of the alphabet, strings of numbers, for example telephone numbers, the months of a year, the seasons, and events in the day. Younger children may also find it hard to remember the days of the week [10].
Children paying attention must be distinguished from concentration. Paying attention is a body function, and therefore does not need to be taught. However, paying attention as such is a function that is quite useless for the act of learning, because it is only a fleeting occurrence. Attention usually shifts very quickly from one object or one thing to the next. The child must first be taught to focus his attention on something and to keep his attention focused on this something for some length of time. When a person focuses his attention for any length of time, we refer to it as concentration. Dyslexic child learning disabilities can be a debilitating problem in school. In today’s world, mathematical knowledge, reasoning, and skills are no less important than the ability to read. The effects of mathematics failure during the years of schooling, as well as mathematics illiteracy in adult life, can seriously handicap both daily living and vocational prospects. According to the statistics approximately 6% of school-age children have significant mathematics difficulties and among students classified as learning disabled, arithmetic difficulties are as pervasive as reading problems. This does not mean that all reading disabilities are accompanied by mathematics problems, but it does mean that mathematics problems are widespread and in need of equivalent attention and concern as reading problems [11].
Objectives
Statement of the problem
A Study to Evaluate the Effectiveness of Planned Teaching Programme on Knowledge Regarding Dyslexia among Primary School Teachers Working in Selected Primary Schools of BVV Sangha in Bagalkot. To help in clarifying the study the following objectives were formulated:
A. To assess the knowledge level regarding dyslexia among primary school teachers.
B. To evaluate the effectiveness of planned teaching programme regarding dyslexia among primary school teachers.
C. To find out the association between pretest knowledge regarding dyslexia with selected socio-demographic variables. Hypothesis
a. H1: The mean post-test knowledge score of primary school teachers exposed to planned teaching programme on dyslexia will be significantly higher than their mean pretest score.
b. H2: There will be significant association between knowledge regarding dyslexia among primary school teachers with their selected socio-demographic variables.
Research Design
In this study the pre-test and post-test was carried out for the assessing the knowledge of primary school teachers regarding dyslexia. Pre-test was conducted on the day one, and administration of P.T.P. and post-test was conducted on day 8th.
Setting of the Study
It refers to the area where the study is conducted. It may be natural setting or laboratory setting depending upon the study topic and researcher’s choice. The study was conducted in selected Primary schools of Bagalkot and teachers were selected by the simple random technique. Primary schools at Bagalkot, those are coming under the management of private as well as government sectors selected for the study at Bagalkot.
Population
Population is a group whose members possess specific attributes that a researcher is interested to study or population refers to the aggregate or totality of all subjects or members that confirm to a set of specifications.
Target population
The target population of the present study consists of all teachers working in primary schools private as well as government sectors at Bagalkot.
Accessible population
The accessible population of the present study consists of teachers working in primary schools are managed by private as well as government sectors of Bagalkot.
Sample
Sample is a small portion of the population selected for observation and analysis [12]. The sample for the present study composed of 300 teachers of selected private as well as government schools at Bagalkot.
Sample size
In the present study, the sample size is 300, primary school teachers.
Sampling technique
Sampling refers to the process of selecting the portion of population to represent the entire population1. In this study simple random sampling entitles the conscious selection by the researcher of certain subjects or elements to include in the study.
Criteria for Selecting the Sample
The sample selection was based on the following inclusion and exclusion criteria.
Inclusion criteria
A. The teachers who are working in selected Primary schools at Bagalkot.
B. The teachers who are available at the time of data collection.
C. The teachers who are willing to participate in the study.
D. The teachers who can understand and read English and Kannada.
Exclusion criteria
a. The teachers who are not willing to participate in the study.
b. The teachers who are not available during data collection.
c. Teachers who are working other than Primary schools at Bagalkot.
d. Teachers who are sick at the time of study.
Data Collection Instruments
Data collection instruments are the procedures or instruments used by the researcher to observe or measure the key variables in a research problem [13]. The study was planned to assess the knowledge and co-relation between level of knowledge. Hence, questionnaire was selected as appropriate technique for collecting data. A Self-administered structured closed end knowledge questionnaire was found to be the most appropriate tools to collect relevant data.
Development of Tool
The following steps were carried out in the preparation of the instrument.
A. Blue print for tool was prepared.
B. Information was collected by vast reviewing the literature and guidance from subject experts.
C. Drafted tool got approved from local research committee and sent to experts for content validation.
D. Correction and modification of tool carried out as per suggestion of experts.
E. Conducted pilot study tested feasibility of tool. Item analysis was done, and tool found reliable.
Scoring system
Knowledge questionnaire consisted of 36 items related to Dyslexia. Each item had four alternative responses, out of four preformed answers students are requested to answer for one best possible answer. One (1) score given for each correct question and zero (0) for wrong answer. The maximum score was 36 and lowest score was (0) zero.
Validity of the Tool
Content validity
The content Validity refers to the degree to which an instrument accurately measures, what it is supposed to measure [14].
Content validity of tool and PTP was established
A. With the help of experts from the Pediatrics, Psychiatry, and Pediatrics Nursing departments, made necessary changes and modifications according to their opinions and suggestions.
B. To ensure content validity, the tool along with blue print and content validity criteria checklist were given to nine experts like Pediatrician (Medical and Nursing), medical social workers, English, statistician, Kannada personnel to establish validity of the tool. Finally, there were 36 knowledge questions and 75% agreement by the experts and other modification made as per expert’s suggestion.
C. The tools validated by the expert’s later tool were given to language experts to translate entire items in to Kannada. The translated tool matched to original tool for makes elucidate for using it for study.
Pre-testing of the tool
Pre-testing of the tool was done to check clarity of items, ambiguity of the language and feasibility of the tool. Formal permissions were obtained from the both the principal. The tool was administered to 5 teachers who were selected by simple random sampling. The average time taken by each subject to respond to the knowledge items 35-40 minutes. The terms, which teachers found difficulty to understand were changed to simple words. The tool was found to clear feasible and there was no ambiguity in language.
Reliability
Reliability is the degree of consistency that the instrument of procedure demonstrates whatever it is measuring it does so consistently [15-19]. To establish the reliability of the tool the split half technique and Spearman-Brown prophecy formula used. Reliability was found by using split half method formula for knowledge questionnaire, reliability score was 0.8706, which was statistically significant. Karl Pearson’s coefficient correlation was used to calculate reliability of half test.
ru=2r/(1+r)
Hence, the tool was found to be reliable for the study.
Ethical consideration
Formal permission was obtained from the principal of Sajjalashree institute of nursing sciences and selected Primary schools of Bagalkot before conducting the study. Written consent was obtained from all participants of the study after explaining the purpose of the study to the teachers. The subjects were assured that confidentiality would be maintained on information.
Pilot Study
A pilot study is a small preliminary investigation of the same general character as the major study. It is designed to acquaint the researcher with the problems to be corrected in preparation for the larger research project and try out the problems for collecting the data [20-23].
The purpose and usefulness of the pilot study as follows:
A. To identify the problem related to study
B. To examine reliability of tool
C. To refine the draft of tool and P.T.P are complimentary feeding
D. To refine research methodology
E. To get live experience of research study
F. To determine feasibility of proposed study.
The pilot study was conducted in selected Primary schools of Bagalkot, Karnataka from 21/11/2017 to 28/11/2017 to assess the feasibility and practicability of the design, involving 30 teachers working in selected Primary schools at Bagalkot [24]. The purpose and usefulness of the study was explained to the participants and written consent was taken from them, prior to the study for their co-operation. They were also assured of the confidentiality of their responses. By using self-structured questionnaire, a pretest was done before the PTP which was followed by the posttest after 7 days of planned teaching programme. The research tool was found to be feasible and practicable. Hence, no change was made after the pilot study.
Data collection process
The data collection process involves the precise, systematic gathering of information relevant to the research purpose questions, or hypothesis of a study [25]. The data collection period extended from 01/12/2017 to 12/12/2017. 300 teachers working in selected Primary schools of Bagalkot. The pretest knowledge questionnaire was administered, which was followed by a PTP, which was followed by the posttest after 7 days. The data collection process was terminated after thanking the participants for their participation and co-operation [26].
Plan for data analysis
Analysis is the systematic organization and synthesis of research data and the testing of the research hypothesis using that data. The data obtained will be analyzed by using frequency, percentage, mean, standard deviation, descriptive and inferential statistics. The data will be presented under the following headings:
Section I: Demographic characteristics of the sample:
Description of sample characteristics Baseline data containing sample characteristics (socio-demographic data) would be analyzed using frequency and percentage.
Section II: Assessment of existing knowledge regarding dyslexia among teachers (Pre-Test): The knowledge of the teachers would be analyzed using frequency, percentage, mean percentage and standard deviation.
Section III: Assessment of knowledge regarding dyslexia after P.T.P (Post-Test): The knowledge of the teachers would be analyzed using frequency, percentage, mean percentage and standard deviation.
Section IV: Effectiveness of P.T.P regarding dyslexia: It would be calculated by using frequency, mean and percentage.
Section V: Testing of hypothesis: Given below
A. Testing the hypothesis for the effectiveness of P.T.P: The effectiveness is calculated by paired t test, mean percentage and standard deviation.
B. Association between knowledge score and selected demographic data: Association between knowledge scores and selected demographic data such as age, gender, marital status, religion, educational status, work experience in teaching, attending any workshop and source of information would be found out by using Chi-Square test. The analysis of the collected data and its interpretation are presented in the following result chapter.
Result
Organization of findings
In this study the data collected was organized, tabulated, analyzed and interpreted by means of statistical tables and graphs and is organized under the following headings.
A. Section I: Demographic Characteristics of the Sample.
B. Section II: Assessment of existing knowledge regarding dyslexia among teachers (Pre-Test)
C. Section III: Assessment of knowledge regarding dyslexia after P.T.P (Post Test)
D. Section IV: Effectiveness of P.T.P regarding dyslexia.
E. Section V: Testing of hypothesis:
a. Testing the hypothesis for the evaluation of effectiveness of PTP.
b. Association between the pre-test knowledge with socio demographic variables.
Section I: Demographic characteristics of the sample
This section describes the distribution of sample according to age, gender, marital status, religion, educational status, work experience in teaching attended any workshop/conferences, and source of information. 300 samples (teachers) were selected from the Primary schools of Bagalkot, by using descriptive statistics data were analyzed, presenting of items done by in terms of frequency, percentage and diagrams. The frequency and percentage of sample in relation to their demographic characteristics are presented in the following diagrams.
Age: The bar diagram shows that the highest percentage (26%) belongs to 30-35 years of age, higher percentage (22%) belongs to 25-30 years of age and lowest percentage (14%) belongs to below 25 years of age. Hence majority (48%) of the sample is between the age group of 25-35 years of age (Figure 1).
Figure 1:Bar diagram depicting the percentage wise distribution the study sample according to age.
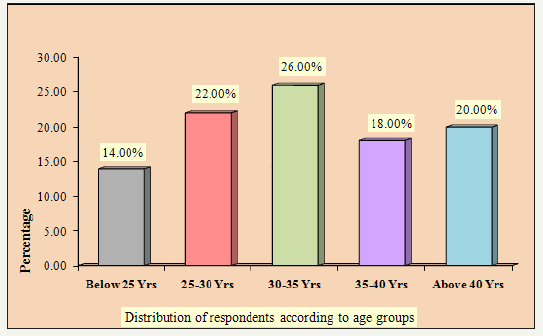
Figure 2:Bar diagram depicting the gender wise distribution of the study sample.
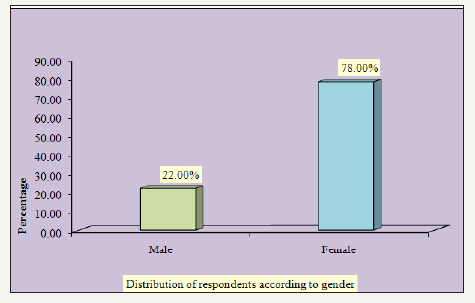
Gender: The bar diagram shows that the highest percentage (26%) belongs to 30-35 years of age, higher percentage (22%) belongs to 25-30 years of age and lowest percentage (14%) belongs to below 25 years of age. Hence majority (48%) of the sample is between the age group of 25-35 years of age (Figure 2).
Figure 3:Bar diagram depicting the marital status wise distribution of the study sample.
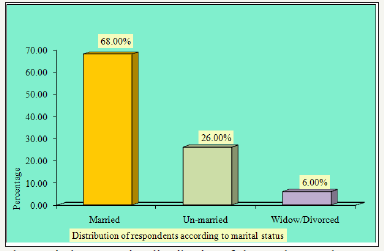
Marital status: The bar diagram shows that majority (68%) of the sample was married, (26%) sample was unmarried and the rest (6%) divorced/widow (Figure 3).
Religion: The bar diagram shows that the highest (84%) of the sample belongs to Hindu region higher (16%)of the sample belongs to Muslim religion and no sample (00%) belong to Christians (Figure 4).
Figure 4:Bar diagram depicting the religion wise distribution of the study sample.
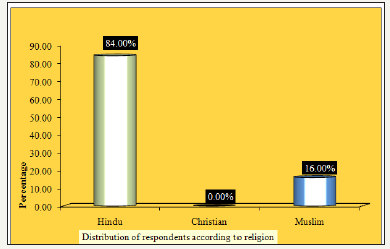
Figure 5:Bar diagram depicting the education wise distribution of the study sample.
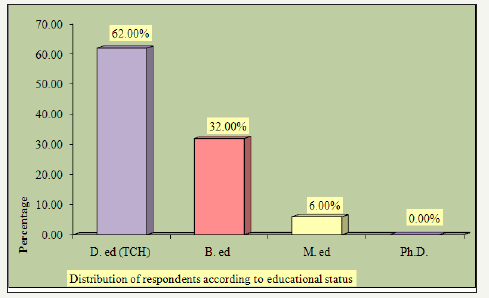
Educational status: Majority of (62%) of the samples were completed their D. ed (TCH), (32%) B. ed, (6%) M. ed and no one completed their Ph. D (Figure 5).
Work experience in teaching profession: The bar diagram shows that (46%) of the samples had 10-15 years teaching experience (32%) had 5-10 years (14%) had 1-5 years teaching experience and 8% had more than 15 years’ experience (Figure 6).
Figure 6:Bar diagram depicting the work experience in teaching profession distribution of the study sample.
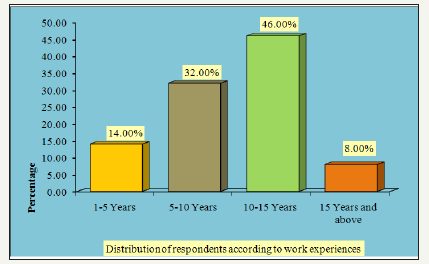
Figure 7:Bar diagram depicting the have you attended any work shop or conference regarding Dyslexia? wise distribution of the study sample.
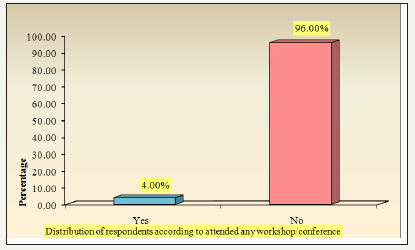
Have you attended any work shop or conference regarding Dyslexia? The bar diagram shows that majority of (96%) of the sample not attended any workshop/conference and rest of (4%) attended (Figure 7).
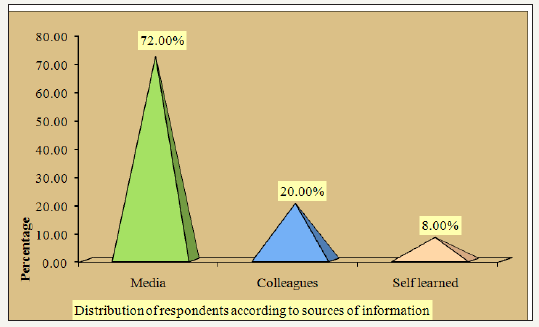
Sources of information regarding Dyslexia: The pyramidal diagram shows that majority (72%) of the samples source of information was media (8%) self-learned and (20%) by colleagues (Figure 8).
Figure 8:Pyramid diagram depicting the sources of information regarding Dyslexia wise distribution of the study sample.
Section II: Assessment of existing knowledge regarding dyslexia among teachers (Pre- Test)
In the present study the distribution of knowledge level according to scores in Table 1 & 2. Distribution of study subjects according to levels of knowledge in pre-test and post-test in Table 3. Assessing the knowledge regarding dyslexia after P.T.P (Post Test) in Table 4. Above Table 4 represents after implementation of planned teaching programme (POST TEST) about 340(68%) subjects had adequate knowledge 160(32%) satisfactory knowledge, and there are no any subjects with inadequate knowledge regarding Dyslexia.
Table 1:Single group pre-test and post-test design.

Table 2:Distribution of knowledge level according to scores.

Table 3:Distribution of study subjects according to levels of knowledge in pre-test.
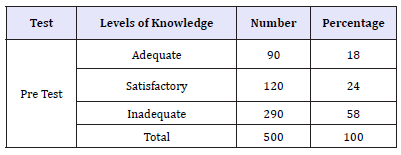
Table 4:Post test knowledge of teachers.

Effectiveness of PTP on dyslexia among teachers
In this section mainly we will compare the Pre-test knowledge scores (before implementation Planned Teaching Programme) and Post-test knowledge scores (after implementation of Planned Teaching Programme). Majority of the sample 290 (58%) had inadequate knowledge before the implementation of P.T.P. After the implementation 160 (32%) had satisfactory and 340 (68%) had adequate knowledge. The effectiveness of the P.T.P was about 58% and there was no sample with inadequate knowledge. It shows that the P.T.P was effective (Table 5).
Comparison of socio demographical variables with knowledge score
Results of above Table 5 reveals that there is a significant difference was observed between age group of subjects with respect to their mean pre-test knowledge scores (f=28.5358, p=0.0000). So, it means that the study subjects belong to above 40 years age group have significant higher knowledge score as compare to others age groups. Similarly, in post-test knowledge scores (f=15.0329, p=0.0000) above 40 years age group have significant higher knowledge score as compare to others age groups. The mean scores according to different age groups of pre and post-test are presented in above Table 6. All age groups differ statistically significant with respect to the total knowledge scores (F=28.5358, P=0.0000) in pre-test. Similarly, all age groups differ statistically significant in (F=15.0329, P=0.0000) post-test also. The pre and post-test total knowledge scores by age groups are also represented in the following Figure 8.
Table 5:Effectiveness of PTP on dyslexia among teachers.

Association between socio-demographic characteristics and levels of pre-test knowledge regarding dyslexia
Table 6:Comparison of age groups with respect to pre-test and post-test knowledge scores (%).

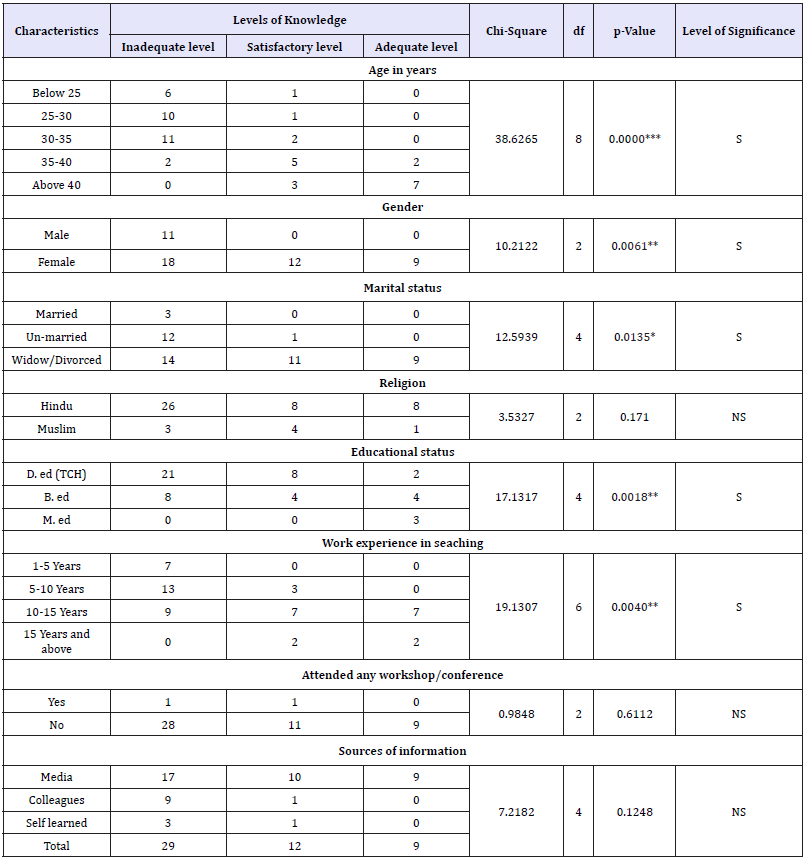
Table 7:Association between socio-demographic characteristics and levels of pre-test knowledge.
*p< 0.05.
The above Table 6 shows that there is a significant association between pretest knowledge regarding dyslexia with the demographic variables such they include, like Age, Gender, Marital status, educational status and work experience in teaching, and some of the socio demographic did not get significant they are religion, attended any workshop/conference and sources of information Therefore, the research hypothesis H2 “There will be significant association between knowledge regarding dyslexia among primary school teachers with their selected socio-demographic variables” as stated by the investigator earlier was accepted (Table 7).
Discussion
Description of socio-demographic characteristics of sample
A. Age groups of the teachers were in between below 25 years to above 40 years, in that majority (26%) of the samples was between 30-35 years, & least (14%) belongs to below 25 years.
B. Both male and female teachers were participated in the study, among them Majority (78%) of the sample was females and the rest (22%) males were participated.
C. Majority (68%) of the teachers was married (26%) of the teachers were un-married and the rest (6%) divorced/widow.
D. Majority (84%) of the sample were Hindus, while (16%) Muslims and (00%) Christians.
E. Most of teachers completed their (62%) D. ed (TCH), (32%) B. ed, (6%) M. ed and no one completed their Ph. D
F. Majority (46%) of the teachers had 10-15 years teaching experience and least 8% had more than 15 years’ experience, (32%) had 5-10 years and (14%) had 1-5 years teaching experience.
G. Majority of (96%) of the teachers not attended any workshop/conference regarding dyslexia and rest of (4%) attended.
H. Most of the teachers (72%) source of information regarding dyslexia was media, (8%) self-learned and (20%) by colleagues.
Assessment of existing knowledge regarding dyslexia among teachers (pretest)
The study shows that maximum teachers 58% had inadequate knowledge level (29 teachers), adequate knowledge about 18% (09 teachers) and 24% (12 teachers) were had satisfactory knowledge.
Assessment of knowledge regarding dyslexia after P.T.P
After implementation of planned teaching programme (POST TEST) about 34(68%) subjects had adequate knowledge 16(32%) satisfactory knowledge, and there are no any subjects with inadequate knowledge regarding Dyslexia. A similar study was conducted on dyslexia and its knowledge among teachers of public-school in selected cities of Nagpur. Study objectives were to assess the knowledge of dyslexia and its early prevention. With a systematic stratified sample of 45 teachers. Results showed that 71.3 percent of teachers scored less than average, and 13.4 percent of the teachers had good knowledge regarding dyslexia in the total sample. Study concluded that most of the teachers need knowledge regarding dyslexia and its prevention in earlier stages.
Testing the Hypothesis
Testing the hypothesis for the evaluation of effectiveness of P.T.P
Paired‘t’ test was used to find out the significance of difference between pre-test and post-test knowledge scores of teachers. Findings revealed that the difference between mean pre-test and post-test knowledge scores of teachers found to be statistically significant [t=-10.8420, p=0.0000]. It indicated that PTP was highly effective in improving the knowledge of teachers regarding dyslexia.
Association between pretest knowledge and selected socio demographic variables
A. The chi square test of significant (χ2=38.6265, P=0.0000) is showing that there is significant relation/association between age groups and levels of knowledge of the study samples.
B. The chi square test of significant (χ2=3.5327, P=0.1710) is showing that there is no significant relation/association between religion groups and levels of knowledge of the study samples.
C. The chi square test of significant (χ2=17.1317, P=0.0018) is showing that there is significant relation/association between educational status groups and levels of knowledge of the study samples.
D. The chi square test of significant (χ2=19.1307, P=0.0040) is showing that there is significant relation/association between work experience in teaching groups and levels of knowledge of the study samples.
E. The chi square test of significant (χ2=0.9848, P=0.6112) is showing that there is no significant relation/association between attended any workshop/conference groups and levels of knowledge of the study samples.
References
- Basavantappa BT (1998) Nursing Research New Delhi. JP Brothers, India.
- Berninger VW, Raskind W, Richards T, Abbott R, Stock P (2008) A multidisciplinary approach to understanding developmental dyslexia within working-memory architecture: genotypes, phenotypes, brain, and instruction. Dev Neuropsychol 33(6): 707-744.
- Billard C, Fluss J, Ducot B, Bricout L, Richard G, et al. (2009) Deficits in reading acquisition in primary school: Cognitive, social and behavioral factors studied in a sample of 1062 children. Rev Epidemiol Sante Publique 57(3): 191-203.
- Bull L (2009) Survey of complementary and alternative therapies used by children with specific learning difficulties (dyslexia). Int J Lang Commun Disord 44(2): 224-235.
- Stretcher VJ, Rosenstock IM (1997) The health belief model, health behavour and health education, theory, research and practice (2nd edn), San Francisco, California, USA.
- Caylak E (2009) Neurobiological approaches on brains of children with dyslexia. Department of Biochemistry and Clinical Biochemistry, Firat University, School of Medicine, Elazig, Turkey 16(8): 1003-1024.
- Coleman MC (1986) Behaviour disorders theory and practice. (2nd edn), Prentice-Hall Inc, New Jersey, USA, pp. 127-135.
- Draffan EA, Evans DG, Blenkhorn P. Use of assistive technology by students with dyslexia in post-secondary education, School of Informatics, University of Manchester, Manchester, UK.
- Duhan, Kaur P (2000) Mental health promotion for school children. A manual for school teachers and school health workers. Regional office for the Eastern Mediterranean. Indian Psychological Review 122: 193- 195.
- Durlingn. Literature Review. An International Perspective on Dyslexia, Newsland.
- Eisenberg, Leon (1987) Presenting mental neurological and psychosocial disorders. World Health Forum 8(4): 81-87.
- Forkstam C, Folia V, Uddén J, Ingvar M, Hagoort P, et al. (2008) Implicit learning and dyslexia. Ann N Y Acad Sci 1145: 132-150.
- Germano GD, Capellini SAH (2008) Efficacy of an audio-visual computerized remediation program in students with dyslexia. Pro Fono Marília 20(4): 237-242.
- Hornstra L, Denessen E, Bakker J, Van den Bergh L, Voeten M (2010) Teacher attitudes toward dyslexia: effects on teacher expectations and the academic achievement of students with dyslexia J Learn Disabil 43(6): 515-529.
- Jones R, Burden RL (2010) Are they just lazy? Student teachers’ attitudes about dyslexia. Dyslexia 16(1): 66-86.
- Kalantre S, Upadhye S, Karande S, Ahuja S (2001) Approach to learning disability. Indian Pediatrics 68(6): 539-546.
- Kanner Leo (2000) Child psychiatry. (3rd edn), Sterling Publishers Pvt Ltd, Illinois, pp. 596-602.
- Kast M, Meyer M, Vögeli C, Gross M, Jäncke L (2007) Computer based multisensory learning in children with developmental dyslexia. Restor Neurol Neurosci 25(3-4): 355-369.
- Krasowicz KG, Borkowska AR, Pietras I (2009) Rapid automatized naming, phonology and dyslexia in polish children. Med Sci Monit 15(9): CR460-CR469.
- Kulkarni M, Sunil K, Anjana T, Hetal M, Rukhshana S (2006) Educational provisions and learning disability. Indian J Pediatr 73(9): 789-793.
- Leonard CM, Eckert MA (2008) Asymmetry and dyslexia. Department Dev Neuropsychol 33(6): 663-681.
- Medeioos, Donald C, Porter, Barbera J, David WI (1983) Children under stress. (1st edn), Prentice Hall Inc, New Jersey, USA, pp. 200-202.
- Menghini D, Finzi A, Benassi M, Bolzani R, Facoetti A, et al. Different underlying neurocognitive deficits in developmental dyslexia: a comparative study. neuroscience department, children’s hospital bambino gesù, research hospital, rome, psychology department, Europe.
- David M, Patricia T (2007) A survey-based exploration of the impact of dyslexia on career progression of UK registered nurses. Journal of Nursing Management 15(1): 97-106.
- Orban P, Lungu O, Doyon J (2008) Motor sequence learning and developmental dyslexia. Ann N Y Acad Sci 1145: 151-172.
- Pennington BF, Bishop DV (2009) Relations among speech, language, and reading disorders. Annu Rev Psychol 60: 283-306.
© 2018 Chetan S Patali. This is an open access article distributed under the terms of the Creative Commons Attribution License , which permits unrestricted use, distribution, and build upon your work non-commercially.
 a Creative Commons Attribution 4.0 International License. Based on a work at www.crimsonpublishers.com.
Best viewed in


.jpg)


 Editorial Board Registrations
 Submit your Article
 Refer a Friend
 Advertise With Us
.jpg)


.jpg)


.bmp)
.jpg)
.png)
.jpg)


.png)

.png)


.png)


