
- About Us
- Guidelines
-

The Author ensures that the research has been conducted responsibly and ethically with adherence to all relevant regulations. read more..
- For Authors
- For Reviewer
- Manuscript Guidelines
- Membership
-
- Journals
- Reprints
- e-Books
- Videos
- Indexing
- Contact Us
 COVID-19
- Submissions


Full Text
Aspects in Mining & Mineral Science
The Formation of Two-Phase Periodic Structures
Alex Guskov*
Institute of Solid State Physics of RAS, Russian Academy of Sciences, Russia
*Corresponding author: Alex Guskov, Institute of Solid State Physics of RAS, Russian Academy of Sciences, Chernogolovka Moscow dist, Russia
Submission: October 22, 2017; Published: February 09, 2018

ISSN: 2578-0255 Volume1 Issue1
Abstract
The modern theory of phase transitions cannot explain the results of many experiments of inter-phase mass transfer. One reason for this is the assumption that during crystallization the solution is in the meta-stable state. The decomposition of the solution occurs by binodal scenario in this case. Crystallization nuclei form and grow in solution. The purpose of this study to show that in many cases the solution during crystallization is in an unstable state. The unstable condition leads to decomposition the solution by spinodal scenario.
Keywords: Decomposition; Solution; Reverses diffusion; Spinodal; Phase diagram
Introduction
Eutectic periodic structures that appear during the solidification, for example, of eutectic melts have attracted widespread interest for several decades from both the fundamental and applied viewpoints. However, the complex space-time dynamics of the formation of a periodic two-phase structure from a homogeneous melt is still unknown. In particular, of fundamental importance in this process is the nature of morphological by unstable simple spatially periodic steady states, which make the dynamics complex [1]. The variety of the shapes and sizes of the structures solidified is specified by nonequilibrium processes at the solid-liquid interface. The current status of research on solidification is comprehensively reviewed in [2]. Among other things, this review considers the interface stability during the formation of three-dimensional dendritic structures (i.e., in the course of the oriented growth of the dendrite tip and the formation of dendrite branches) and during cellular solidification, as well as the morphological instability and oscillation of the interface during the formation of eutectic structures. The most popular theory describing the solidification of eutectic melts with formation of periodic structures is the Jackson-Hunt theory [3]. This theory, however, does not explain the origin of the periodic structures and faces difficulties when selecting solutions to the equations derived. Characterizing the state of the art in the theory of eutectic solidification, Hunt & Lu [4] indicated that, in spite of the certain progress in understanding eutectic, monotectic, and peritectic growth, most works are only qualitative. They also noted that a further advance can only be achieved by constructing a model of non-steady-state growth and that it would be appropriate to develop a simpler analytical model for monotectic growth and check the stability of phase coexistence. Many researchers believe that the basic cause of the periodic structure formation is the instability of the interface during solidification. Beginning from the classical work [5], numerous simulations of directional solidification that give qualitative agreement with experimentally observed structures have appeared. However, quantitative results that provide a good fit to experimental data are very scarce. One of them is the dependence of the eutectic structure period on the interface velocity [6-10]. This dependence coincides exactly with the experimental dependences for a number of materials. In this study it is show that in many cases the solution during crystallization is in an unstable state. The unstable condition leads to decomposition the solution by spinodal scenario and leads to periodic structure of eutectic composites.
Let us consider at the differences in the mechanisms of decomposition of metastable and unstable solutions. The physical meaning of binodal decomposition is that in super cooled solution clasters of a new phase are constantly forming and decomposing. The cluster continues to grow and forms a new phase, if it reaches a critical size. The new phase has a sharp boundary, as shown in the Figure 1a & 1b.
Two facts are important for further discussion. Firstly, the solution decomposes not throughout the entire volume simultaneously, but growth of individual clusters of the new phase occurs. And secondly, during decomposition at the interface there is a jump of concentration. The magnitude of the concentration jump depends on the difference of the components solubility in liquid and solid solutions. Spinodal decomposition is of other nature. Spinodal decomposition is associated with the dependence of the interaction potentials of the solution particles on the environmental conditions. Some thermodynamic conditions lead to a homogeneous distribution of the components throughout the entire volume of the solution. In this case, an excess of one of the components in any area will lead to diffusion of this component, and the solution will remain homogeneous. The other thermodynamic conditions lead to decomposition of the solution to the phases having different concentration. In this case, any arbitrarily small fluctuations of concentration (or temperature) lead to the situation when the particles of different varieties will diverge. A homogeneous solution will decompose to two solutions with different concentrations of the components (Figure 1b).
Figure 1: Scheme of solution decompositiom by binodal (a) and spinodal (b) scenario.

It is important to note that in the case of spinodal decomposition any energy barrier does not exist. The system is unstable to arbitrarily small fluctuations. Decomposition starts immediately after transfer of the solution into the unstable state. The particles immediately begin to diffuse into the area in which there was an excess of this component. Concentration of the excess component in this area increases gradually, without sharp boundaries. The unstable solution decomposes immediately in all the unstable area. Decomposition ofthe solution ends with formation ofthe equilibrium phases with sharp boundaries between them. The scheme of the start and the end of the solution decomposition is shown on Figure 1. The diagram shows that the decomposition scenarios differ at the beginning and in the process of decomposition. The result of both scenarios is the same. Therefore, it is difficult to distinguish between binodal and spinodal decomposition by the end result of decomposition. The process of spinodal decomposition, however, occurs by continuous changes in concentration of the entire volume of the unstable solution. In this it differs from the process of decomposition of solution decomposition by binodal scenario. This difference gives one the opportunity to determine the mechanism of decomposition of the solution decomposition, observing the process of decomposition itself.
Now let us demonstrate the experiments result in which spinodal decomposition of the solution in the process of its crystallization was observed. The cuvette with the solution is moved between the refrigerator and the heater [11]. The temperature of the refrigerator is lower than the temperature of crystallization. As a result the solution freezes, and the interface moves with a given speed of cuvette movement. Bromthymol blue dye aqueous solution is used in order to observe the process of decomposition of the solution decomposition. This solution decomposes to the phases of different colors. One phase is almost pure water, colorless and transparent. The other phase is blue.
At first the experiment shows a homogeneous liquid solution. The forming interface appears after some period of time on the left (Figure 2a). The interface is flat at the beginning. It becomes unstable then. Spatial distortions appear at the interface (Figure 2b). The amplitude of these distortions increases. The solution decomposes into two phases in front of the interface. The Spatial distortions transform into strips with different phases. Then these strips form into the periodic structure (Figure 2c). The experiment shows that crystallization occurs after formation of the periodic structure. There is no equilibrium boundary between liquid and solid phases, as predicted by other theories. This experiment shows also the relation between instability of the interface and the period of the eutectic structure. Thus, the previously theoretically obtained result [9,10] is confirmed: the eutectic structure period is equal to the period of interface instability. It is difficult to show on this clip that decomposition of the solution occurs by spinodal scenario. This is demonstrated by the following experiment.
The cuvette with the solution was located so that the part of the solution was on the cold area of the device, and the other part was on the warm area. The solution was crystallized on the cold part of the device. A flat interface formed between the cold and warm parts of the device. The cuvette was set in motion after the boundary had become stationary. The Figure 3 shows a successive change of the solution concentration. This figure shows that structure formation occurs under continuous, without jumps change in solution concentration. It is clearly seen here that concentration changes simultaneously throughout the entire area of solution decomposition. Periodically alternating strips with different composition are formed from a homogeneous concentration distribution. Decomposition occurs continuously in the vicinity of the interface. This experiment demonstrates that the change of concentration occurs by reverse diffusion. A homogeneous distribution of concentration simultaneously in the entire volume transforms to a modulated distribution in the form of strips of different colors. There are no sharp boundaries of concentrations. That is, decomposition of the solution occurs by spinodal scenario.
Figure 2: Formation of periodic structure during solidification of an aqueous solution bromtimol blue. a - flat interphase boundary, b - emergence of concentration distortion, c - formed periodic structure.

Figure 3: The formation of periodic structures in a thin layer of an aqueous solution bromtimol blue. a-beginning of structure formation, b,c -process of structure formation.

These experiments show that decomposition of the solution occurs by spinodal scenario. Let us show how the solution can get to the area of spinodal decomposition. For this purpose we shall use the locally configuration model of solutions. The expressions for free energy of the solutions of the concentration ci for this model have the form (1). Index i relates to the solid 1 and liquid 2 phases. These expressions correspond to the liquid and the solid.
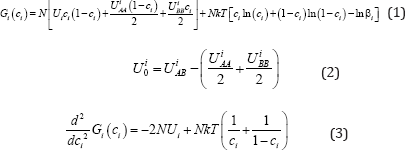
Here k is the Boltzman constant, N is total number of particles and position. β is the logarithmic dependence of entropy on free energy. This model includes the interaction potentials. UiAA, UiBB , UiAB , between the particles of the solution. These interaction potentials change their values during transition from the liquid phase to the solid one. The locally - configuration model includes the parameter that uniquely identifies the boundary of the spinodal area. This parameter is mixing energy (2). The boundary of the spinodal area is determined by the equation (3). This equation (3) contains only three variables of the parameter. These parameters are: concentration, temperature, and mixing energy. Therefore, the convenient state diagram of the solution can be built. For this purpose one needs to add one more coordinate, which is mixing energy. Therefore, the boundary of the spinodal area is uniquely defined at these coordinates. Such a diagram is depicted in the (Figure 4).
Figure 4: Phase diagram of solution taking into account change mixing energy of component.

The liquidus lines b1e1 and e1 f1 are in the plane corresponding to the value of the mixing energy in the liquid phase at these coordinates. The solidus lines b2a2 and d2f2 are in the plane corresponding to the value of the mixing energy in the solid phase. These planes are separated by the values of mixing energy. The border of spinodal decomposition area is built in this chart. The solution decomposes by spinodal scenario if in the process of phase transition it is getting in this area.
Figure 5: Phase diagram of solution taking into account change mixing energy of component.

For example, the trajectory 2 in the Figure 5 between the points "a" and "b" is located in the area of spinodal decomposition. That is, the state of the solution changed successively as it passes between the liquid and the solid phase, following this trajectory. Let us assume that all the trajectories lie on a certain surface. If some set of trajectories intersects of the area of spinodal decomposition, we obtain the intersection curve of the surface of the system trajectories and the boundaries of the spinodal area. The system will be disposed on the trajectories that pass through this curve at different parameters of the stationary regime. This curve is a curve of dynamic equilibrium of the system. Let us construct the projection of the equilibrium curves of the liquid and solid phases, and also the dynamic equilibrium curve in a single plane with a constant mixing energy. Such a phase diagram is shown in the Figure 6.
Figure 6: Equilibrium phase diagram baefd and dynamic phase diagram US -UL.

The phase diagram includes the equilibrium phase diagram baefd and the curve US, UL of dynamic equilibrium. The curve of dynamic equilibrium is similar to the curves of phase equilibrium for the analysis of phase transition. Let us show an effect of such phase transition. Let us look at experimental result that gives the solution to the problem of diffusion, taking into account spinodal decomposition of the solution. The dependence of period of the eutectic structure on the interface velocity
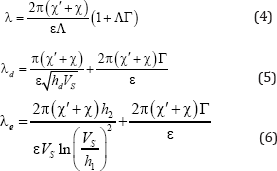
(4) - (6) was found in the works [9,10]. The analytical dependences plotted in the Figure 7.
Here it is plotted several dependences λ(VS). Values of constant correspond to the experimental dependence of the eutectic pattern period on the interface velocity reported in [12]. These dependences can be divided into three families. Most of them are straight lines coming from the origin. They correspond to plots 1(Al2O3-ZrO2), 2(Pb-Sn), 3(ZrO2-MgO), 4(MgO-MgAl2O4) and 5(ZrO2-Y2O3). For the plot 6(CaO-NiO composition), the dependence is a straight line intersecting the axis of ordinates above the origin. For the plot 7(Zn5B4O11 - ZnB2O4 composition), the dependence is an increasing nonlinear curve. The analytical dependences plotted in the Figure 7 coincide with the experimental data [12] up an accuracy of construction.
Figure 7: Dependences period of spatial perturbations on interface velocity for experimental dependences of [12].

However, these expressions were found at the two conditions, which contradict well-known theories of phase transitions. The first condition is the requirement that the segregation coefficient is close to one. This condition is necessary in order to get the expressions (4)-(6) from the dispersion equation [9,10]. The second condition is the requirement that the segregation coefficient is greater than one. This condition gives instability of the interface. Let us explain both of these conditions with the help of spinodal decomposition of the solution during formation of the periodic eutectic structure. For this purpose we shall consider the phase diagram that was obtained above. Let the solution passes through the area of spinodal decomposition during crystallization. The curve of dynamic equilibrium should be used instead of the liquidus line in this case. The curve of dynamic equilibrium is located between the liquidus line and the solidus line. Therefore, the segregation coefficient in this case is smaller than in the case without spinodal decomposition of the solution. It can be close to one in the limiting case. Hence the first condition is satisfied.
Now let us explain instability of the interface during spinodal decomposition of the solution. The cited above papers [9,10] explain instability of the interface by the dependence of the interface velocity on kinetic overcooling (7). Instability occurs when the segregation coefficient in the expression (8) becomes greater than one. Expression (7) can be written as (8), if approximate equality (9) is used.
Let us pay attention to the expression (7). The change in k values larger than one to values less than one is equivalent to change in the sign of the coefficient m. If the phase diagram does not contain a curve of dynamic equilibrium, the sign of m is determined by the slope of the liquidus line and it is negative. If the phase diagram contains a curve of dynamic equilibrium, the sign of m is determined by the slope of the dynamic equilibrium line. In this case the sign of m can be positive. Therefore, the interface will be unstable if the segregation coefficient is less than one. Consequently, both the requirements of proximity of the segregation coefficient to one, and instability of the interfaces are explained by spinodal decomposition of a solution.
The obtained results explain the process of formation of the periodic eutectic structure. No additional assumptions are required in order to explain the sequence of formation of the periodic eutectic structure. A layer of the unstable solution occurs in front of the initially flat interface. The Interface becomes unstable during its movement. Perturbations of the concentration at the interface have a period which depends on the interface velocity. The solution in front of the interface decomposes by spinodal scenario. Thus, the solution will decompose according to the law, which is set by interface instability. Consequently, the period of decomposition of the unstable solution will depend on the interface velocity so as the period of instability of the interface depends on the velocity of its movement.
Conclusion
A crystal periodic structure, for example of an eutectic periodic structure, decompose by spinodal scenario during crystallization. The states of dynamic equilibrium exist in solutions of the eutectic type. These states are described by the boundary of the unstable state of the solution - a spinodal. The line of dynamic equilibrium supplements the equilibrium phase diagram.
The periodic structure of eutectic composites is a result of interaction between instability of the interface, instability of the solution and kinetics of joining of particles to the growing solid phase. The interface instability defines the period of spinodal decomposition of the unstable solution. Kinetics of joining of particles to the growing solid phase determines the dependence of the period of the eutectic structure on the speed of the moving interface.
References
- M Plapp, A Karma (1999) Eutectic colony formation: A stability analysis. Phys Rev E 60(6 Pt B): 6865-6889.
- WJ Boettinger, SR Coriell, AL Greer, A Karma, W Kurz, et al. (2000) Solidification microstructures: recent developments, future directions. Acta mater 48(1): 43-70.
- KA Jackson, JD Hunt (1966) Lamellar and rod eutectic growth. Trans Metall Soc AIME 236: 1129-1142.
- JD Hunt, SZ Lu (1994) Handbook of Crystal Growth (North Holland). 2 Part B, Chap. 17.
- WW Mullins, RF Sekerka (1964) Stability of a planar interface during solidification of a dilute binary alloy. J Appl Phys 35(2): 444-451.
- AP Guskov (1999) A model of planar crystallization of a binary melt. Phys Dokl 44: 330-333.
- AP Guskov (1999) Boundary instabilities at directional crystallization. Bulletin of the Russian academy of sciences "Physics”. Allerton Press, Inc., New York, USA, 63 N9: 1772-1782.
- A Guskov (2000) Model of directed crystallization of binary alloy Comput Mater Sci 17(2-4): 555-559.
- AP Guskov (2003) Dependence of the structure period on the interface velocity upon eutectic solidification. Technical Physics 48(5): 569-575.
- Alex Guskov (2014) On linear analysis of the movement of the interface under directed crystallization. Advances in Chemical Engineering and Science 4(2): 103-119.
- A Guskov, L Nekrasova (2013) Decomposition of solutions in front of the interface induced by directional crystallization. Journal of Crystallization Process and Technology 3(4): 170-174.
- Minford WJ, Bradt RC, Stubican VS (1979) Crystallography and microstructure of directionally solodofied oxide eutectic. Journal of the American Ceramic Society 62(3-4): 154-162.
© 2018 Alex Guskov. This is an open access article distributed under the terms of the Creative Commons Attribution License , which permits unrestricted use, distribution, and build upon your work non-commercially.
Editor In Chief


.jpg)


Signup for Newsletter

Quick Links
 Editorial Board Registrations
 Submit your Article
 Refer a Friend
 Advertise With Us
Our Recent Edition

.jpg)


Top Editors


.jpg)


.bmp)
.jpg)
.png)
.jpg)


.png)

.png)


.png)


Financial Support

Sponsors

Latest e-Books

Latest Video

 a Creative Commons Attribution 4.0 International License. Based on a work at www.crimsonpublishers.com.
Best viewed in
a Creative Commons Attribution 4.0 International License. Based on a work at www.crimsonpublishers.com.
Best viewed in